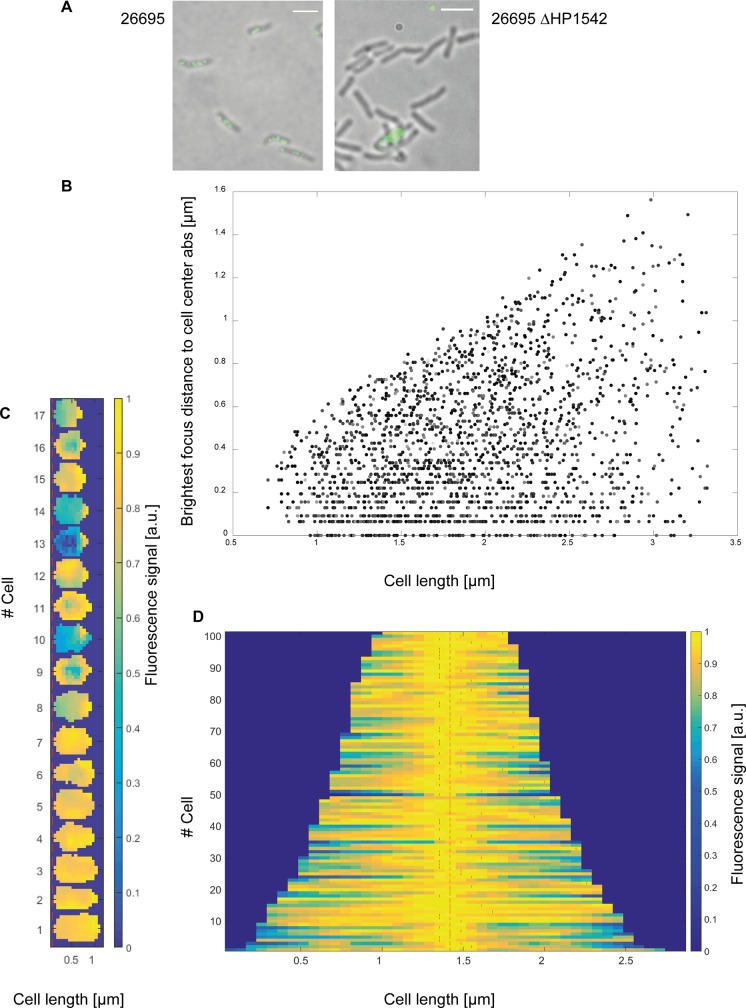
Fig 9. Subcellular localization of HP1542.
(A) 26695 wt and 26695 HP1542 deletion mutant were analyzed by immunofluorescence microscopy (IFM) using an anti-HP1542 primary antibody and an Alexa-Fluor 488-conjugated secondary antibody (scale bar 2 μm). (B- D) Quantitative analysis of the brightest spot of all fluorescence signals using BacStalk software. (B) Scatterplot plot depicting the absolute values of the distance of the brightest spot of all fluorescence signals to mid-cell compared to the cell length of the cells. (C) Demograph of small cells below 1 μm. The fluorescence profiles of individual cells were sorted according to cell length with the shortest cell shown at the top and the longest cell shown at the bottom. (D) Demograph of cells with the brightest focus at a defined mid- cell localization (+/- 0.0 64; n = 101) illustrating additional maxima as indicated with red lines.

