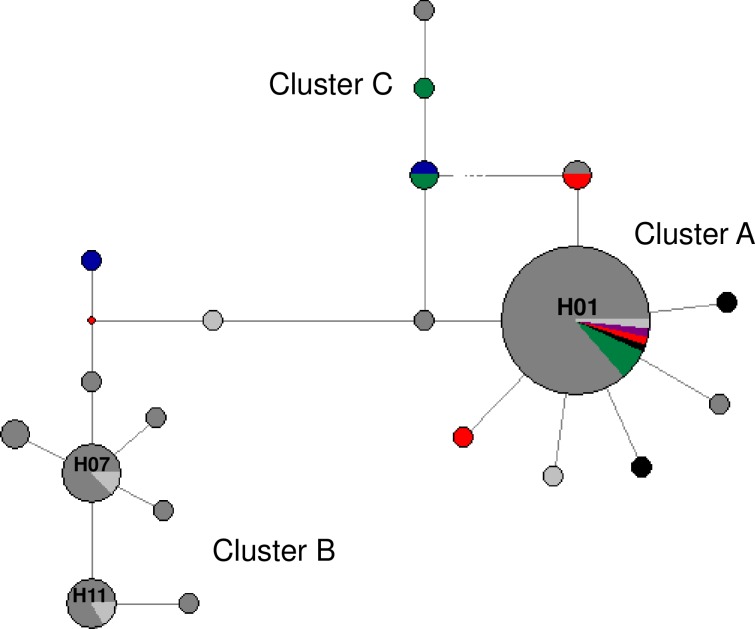
Fig 3. MJ network of 383 bp cox1 locus of Ascaris spp. from Brazil.
The colors of the circles indicate the isolation locality (city). Dark gray: SIRN-AM from this study; light gray: SIRN-AM [21]; green: TER-PI; blue: NSN-PI; red: GUA-RJ [20]; black: CAM-RJ; violet: MG. The area of the circle is proportional to the sequence number.

