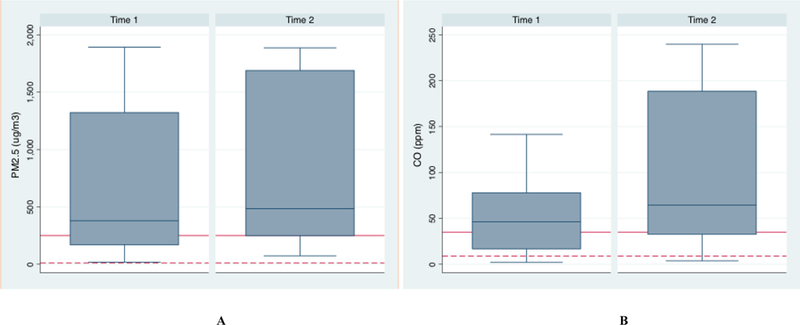
Figure 1.

Box and whisker plots of mean PM2.5 levels (A) at time 1 and time 2 and mean CO levels (B) at time 1 and time 2 inside six waterpipe cafés in North Carolina. Top, middle and lower ends of boxes represent 75%, 50%, and 25% percentiles, respectively. Whiskers represent maximum and minimum mean levels. Solid horizontal lines represent the EPA’s Ambient Air Quality index’s “hazardous” level for PM2.5 (250.5 μg/m3) and EPA’s 1-hour time weighted average exposure limit for CO (35 ppm) for panels A and B, respectively. Dashed horizontal lines represents the EPA’s Ambient Air Quality Index’s “good” level for PM2.5 (12 μg/m3) and the EPA’s 8-hour time weighted average exposure limit for CO (9 ppm) for panels A and B, respectively.
