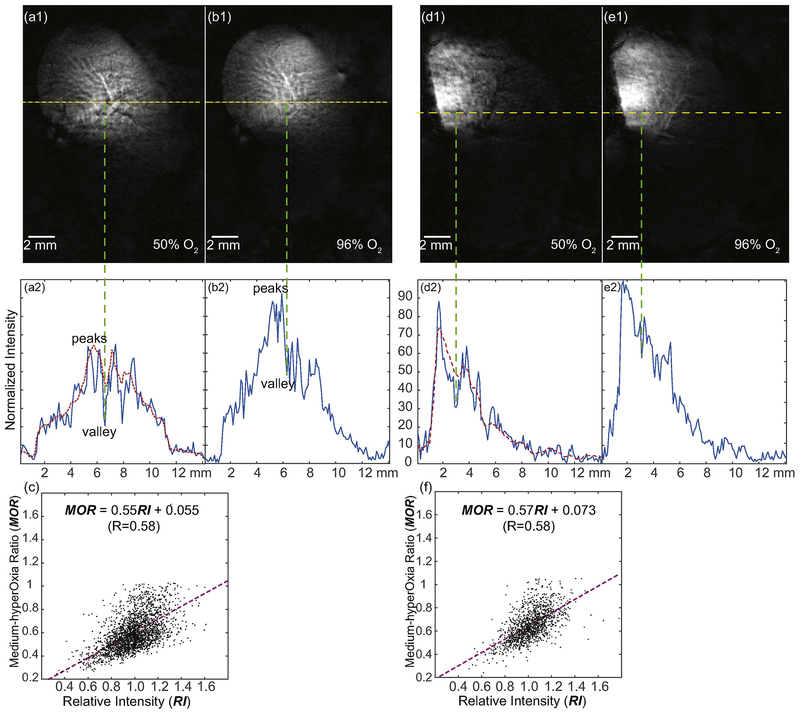
Fig. 3.
High-resolution hemodynamic response images of micro vessels. (a1) is a sensitivity-enhanced image acquired across the renal cortex when the rat was inhaling 50% O2, using TE/TR=20/1200 ms, Flip Angle = 60 deg, 0.1-mm In-plane resolution, 0.8-mm slice thickness. The normalized intensity profile along the yellow-dashed line in (a1) is plotted in (a2). The Relative Intensity (RI) is obtained by dividing the intensity of each pixel with the intensity of the smoothed profile (red dotted line). For each pixel in the image, a smaller RI is indicative of a higher level of oxygen unsaturation. (b1) is the same image acquired on the same kidney region when the rat was inhaling 96% oxygen. (b2) is the corresponding normalized intensity profile with greatly decreased signal contrast between vascular-rich and vascular-sparse regions. (c) shows the positive correlation between the Medium-hyperOxia Ratio (MOR) and the Relative Intensity (RI) in the cortex of a healthy kidney. The MOR of each pixel is obtained by dividing the sensitivity-normalized image acquired under 50%–O2 breathing with that acquired under 96%–O2 breathing. A lower MOR is indicative a higher O2-bearing capacity. (d) and (e) are images acquired on another rat using the same protocol, when the rat was breathing 50% O2 and 96% O2 respectively. (f) shows the reproducible correlation between MOR and RI for this different rat.

