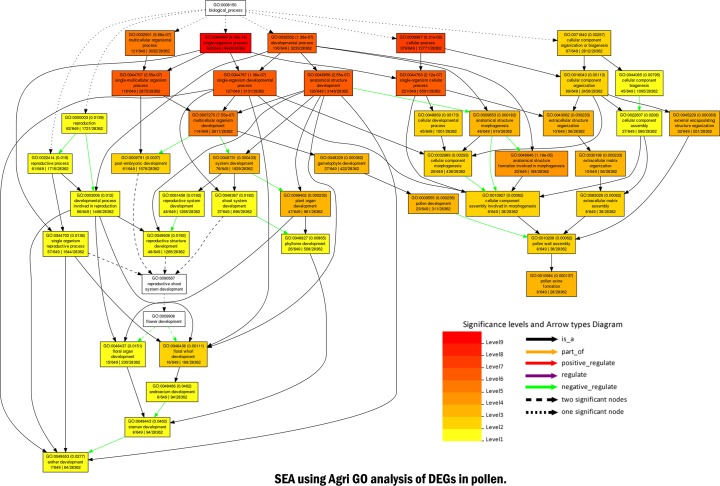
Fig 2. Agri GO analysis of DEGs in floral buds.
Singular enrichment analysis was performed in AgriGO v2 to identify enriched gene ontologies associated with pollen developmental processes. Each box shows the GO term number, the p-value in parenthesis, and GO term. The pair of numerals in the left represents the number of genes in input list associated with that GO term and number of genes in the input list. The pair of numerals in the right represents the number of genes associated with a targeted GO term in the Gossypium database and a total number of Gossypium genes with GO annotations in the Gossypium database. Colour and design of arrow indicate the effect of pathways. Box colors indicate levels of statistical significance: yellow = 0.05; orange = e−5; and red = e−9.

