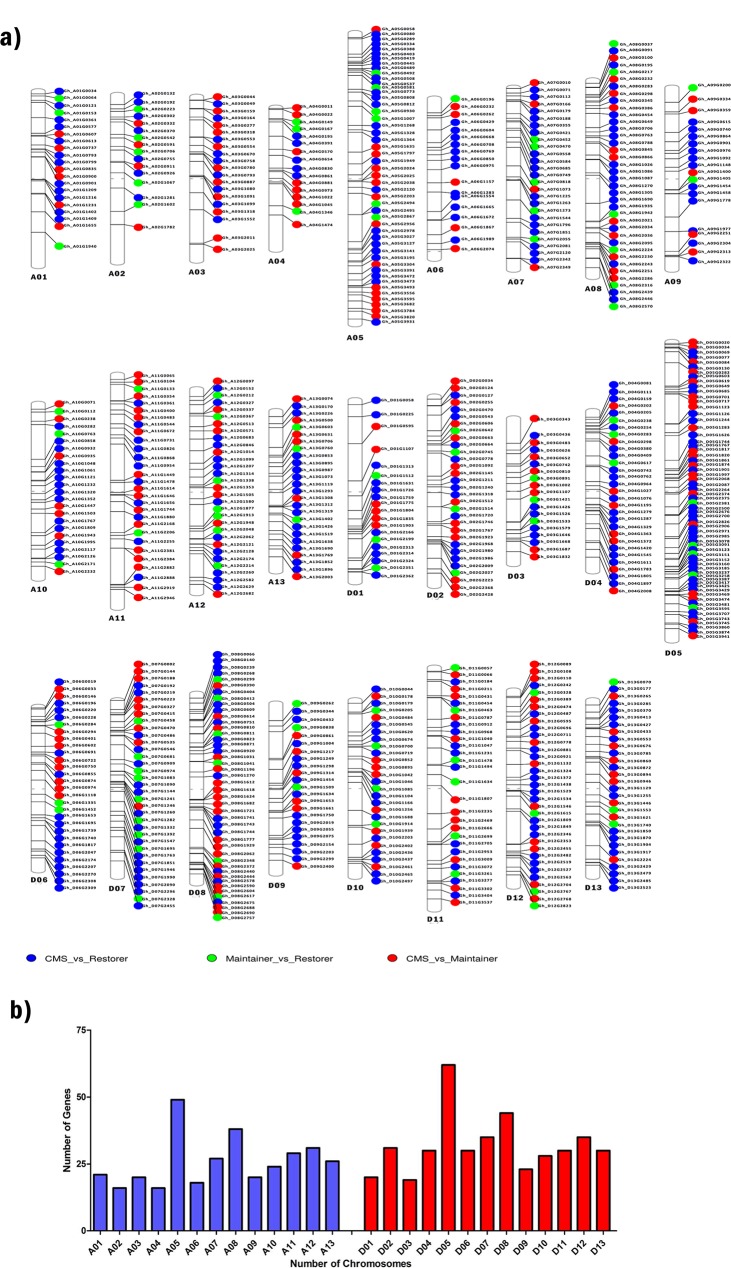
Fig 4.
a) Distribution of differentially expressed genes on chromosomes of Gossypium hirsutum L. Distribution of phenogram showing the exact location of DEGs on each chromosome of Gossypium hirsutum L. b) The total number of DEGs present on each chromosome of cotton. A total number of differentially expressed genes on diploid sets of Gossypium genome A and D. The X-axis represents different chromosomes. Y-axis is DEGS numbers on each chromosome.

