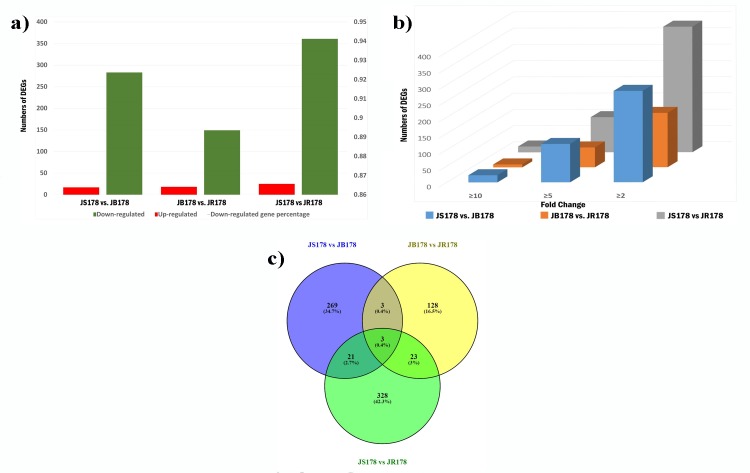
Fig 5.
a) The number of differentially expressed genes (DEGs) between three different lines of cotton. The green color represented up-regulated, the red color represented down-regulated gene numbers on the X-axis, Y-axis represented the number of deferentially expressed genes. b) The fold change wise distributed numbers of genes under the comparison of three different lines. c) Venn diagram showing the distribution of unique and common DEGs among three comparisons.

