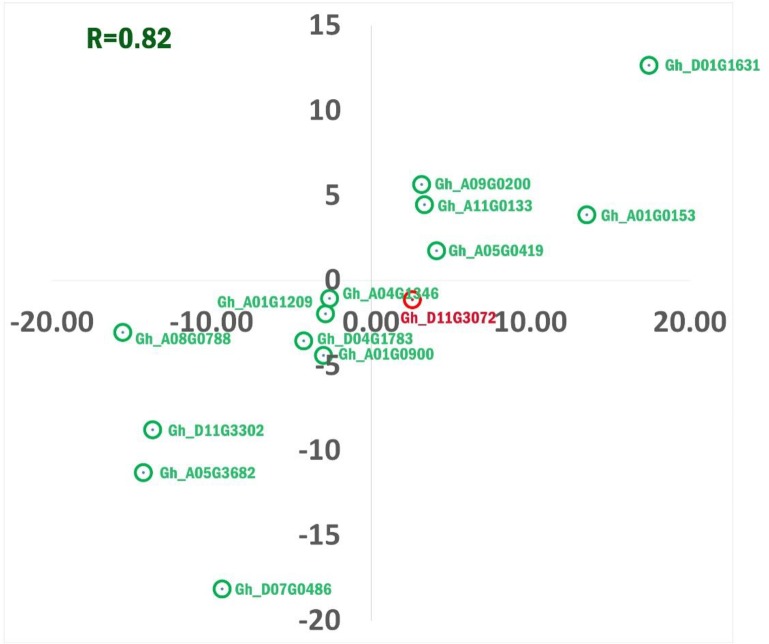
Fig 6. qRT-PCR analysis of gene expression compared with the RNA-seq data.
Expression of 14 transcript as analyzed by quantitative PCR in CGMS and fertile lines of Gossypium hirsutum L. The dots with green colour (thirteen in numbers) indicates concordance whereas, red (one in number) indicates non-concordance of expression profiling in qRT-PCR and RNA-seq.

