. 2019 Jun 24;8:e44698. doi: 10.7554/eLife.44698

Figure 4. Monitoring misfolding by site-specific intra-molecular FRET.

Unlabelled (blue) and TNB-labelled (orange) single Trp, single Cys-containing mutant variants W144-C153, W144-C199, W144-C223, W197-C169 and W197-C223 (A–E) were either co-oligomerized separately with Trp-less moPrP at a dopant concentration of 2 mol% (filled symbols), or in its absence (empty symbols). The corresponding changes in tryptophan fluorescence emission were measured as a function of time. The tryptophan fluorescence signal for the monomeric unlabelled (blue) and TNB-labelled (orange) protein(s) are shown as solid lines, and the corresponding signals for the oligomeric protein(s) are shown as dashed lines. From both sets of data, the kinetics of FRET efficiency change for all five FRET pairs (F–J) was calculated (filled and empty green circles).The black lines through the data are a guide to the eye. The error bars in the fluorescence measurements are standard deviation of the mean, determined from four to five independent measurements, on separate samples. The error bars in the FRET efficiency were determined by propagating the errors in the fluorescence measurements.

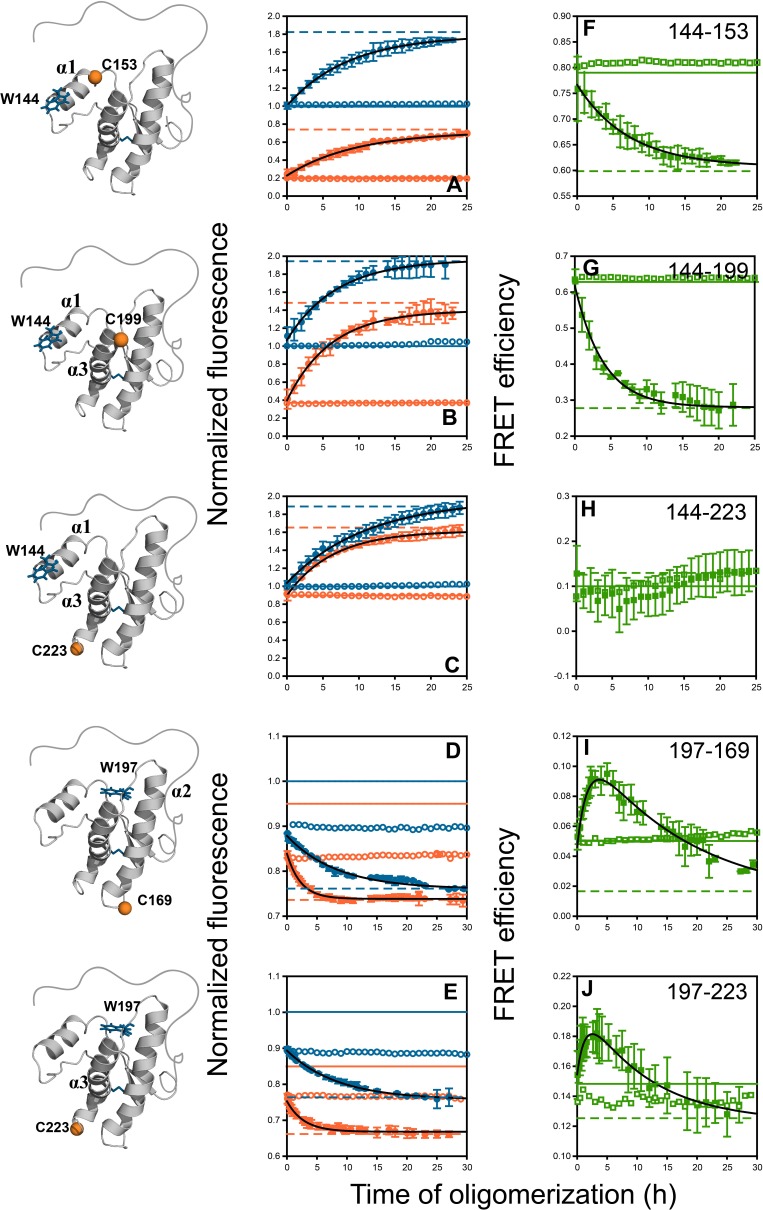
Figure 4—source data 1. Raw data for Figure 4A–J.
DOI: 10.7554/eLife.44698.016

Figure 4.

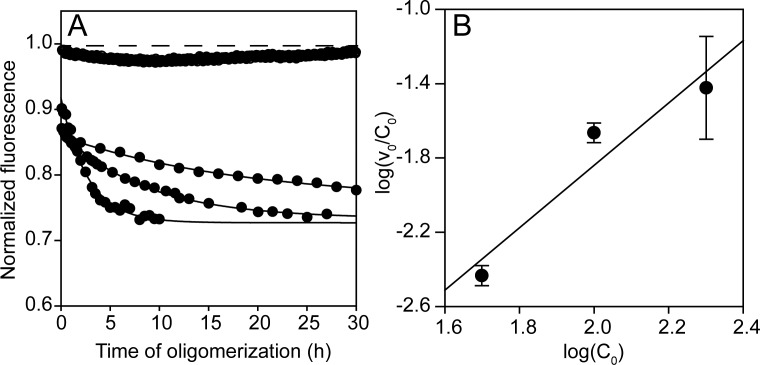
Figure 4—figure supplement 1. Concentration dependence of co-oligomerization monitored by fluorescence intensity.

Figure 4—figure supplement 1.

(A) Co-oligomerization of 49, 98 and 196 µM Trp-less moPrP doped with 1, 2 and 4 µM of unlabelled W197-C223 moPrP, monitored by tryptophan fluorescence, such that the total protein concentration is 50, 100 and 200 µM, respectively, with a fixed dopant concentration of 2 mol%. In the absence of co-oligomerization, the signal remains fixed at 1, indicating the absence of photobleaching in these timescales. The characteristic times for the fluorescence changes for the three cases are ~33 hr, ~8 hr and ~3 hr, respectively. (B) The dependence of log (ν0/C0) (concentration normalized initial rate obtained from the linear regression of the initial 4–5 data points in (A) on log (C0). The slope, n-1 is 1.68, which matches very well with the value of 1.6, obtained previously from NMR measurements (Sengupta et al., 2017).
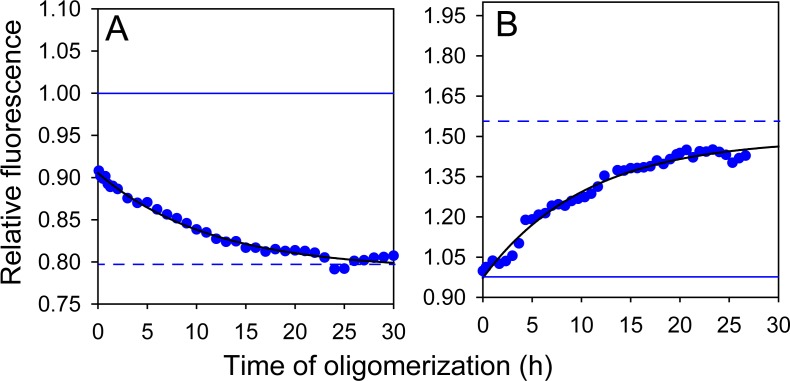
Figure 4—figure supplement 2. Effect of doping ratio on fluorescence-monitored kinetics of co-oligomerization.

Figure 4—figure supplement 2.

Unlabelled (A) W197-C223 moPrP and (B) W144-C153 moPrP were co-oligomerized with Trp-less moPrP at a 1:99 doping ratio, while keeping total protein concentration fixed at 100 µM. Black solid lines are shown as a guide to the eye. The characteristic times for (A) and (B) were estimated to be ~10–11 hr.
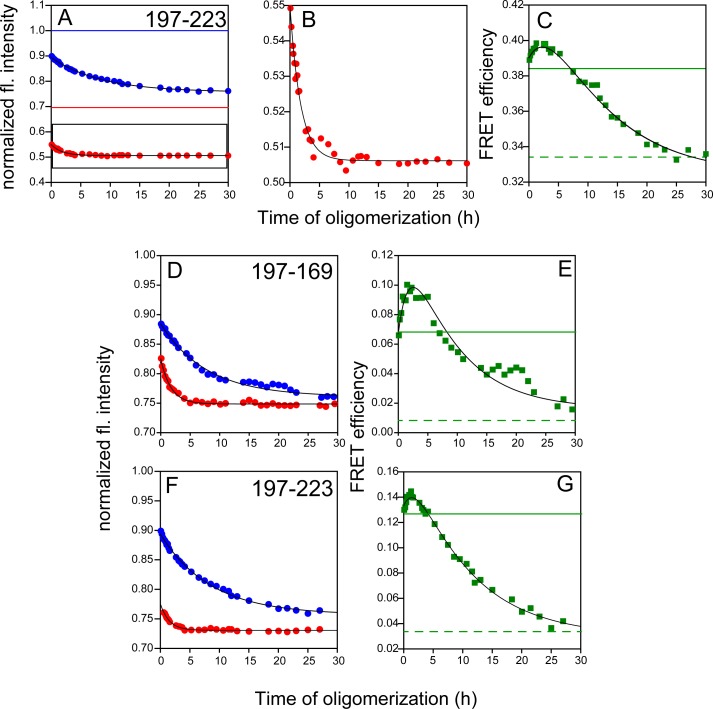
Figure 4—figure supplement 3. FRET monitored site-specific misfolding kinetics with W197-C223-DNP, W197-C169-DANS and W197-C223-DANS.

Figure 4—figure supplement 3.

Unlabelled (blue) and labelled (red) DNP-C2 (A) or DANS-labelled (D and F) single Trp, single Cys-containing mutant variants of W197-C223 and W197-C169 (dopant) were co-oligomerized with Trp-less moPrP, at a dopant concentration of 2 mol%. The corresponding changes in tryptophan fluorescence emission were measured as a function of time. (B) DNP-C2-labelled W197-C223 moPrP (marked in black box in (A)), (D) W197-C169-DANS and (F) W197-C223-DANS also showed faster kinetics, similar to W197-C223-TNB (C) FRET-monitored misfolding kinetics for W197-C223 using the Trp-DNP FRET pair. (E) and (G) Same as (C) except the proteins were W197-C169-DANS and W197-C223-DANS, respectively. Black solid lines are shown as a guide to the eye. The characteristic times for (C), (E) and (G) were estimated to be 1.7 and 14.3 hr, 1.9 and 8.3 hr, 1.9 and 10.0 hr, respectively.
Figure 4—figure supplement 4. Time-resolved fluorescence anisotropy measurements to estimate κ2.

Figure 4—figure supplement 4.

For W197-containing mutant variants in both monomeric and oligomeric forms, two rotational correlation times were observed for both donor tryptophan and acceptor 1,5-IAEDANS (Supplementary file 5). The black dashed lines correspond to the measured fundamental anisotropies of 0.4 and 0.36, respectively, for donor tryptophan and acceptor 1,5-IAEDANS determined from time-resolved anisotropy measurements of free dyes NATA (N-Acetyl-L-tryptophanamide) and 1,5-IAEDANS in 70% glycerol. The significant amplitudes of the fast components suggest that both donor and acceptor are freely rotating and a κ2 = 2/3 can be assumed (See Appendix 1 and Supplementary file 5).
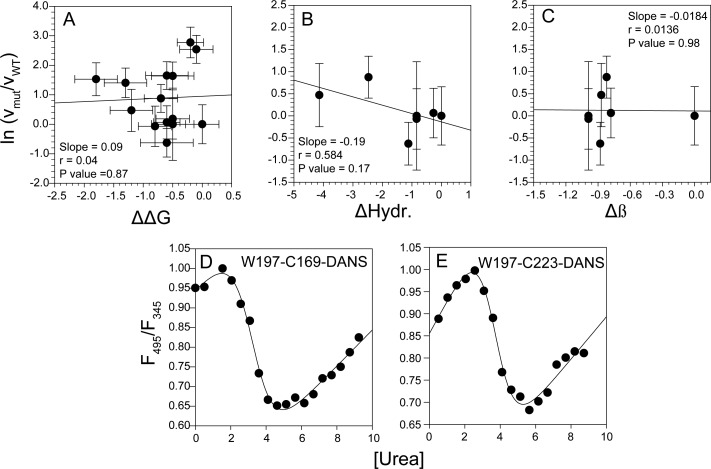
Figure 4—figure supplement 5. Correlation analysis of global misfolding rates with thermodynamic stability and intrinsic physico-chemical properties, and measurement of local stability by FRET ratio and co-oligomerization kinetics by steady-state anisotropy.

Figure 4—figure supplement 5.

No significant correlation was found between the global misfolding rate constant of the mutant variants with change in thermodynamic stability (A), change in hydrophobicity (B) and change in β-sheet propensity (C). The local stabilities monitored by FRET ratio for W197-C169-DANS (D) and W197-C223-DANS (E) mutant variants were comparable to those obtained from HX-MS and HX-NMR measurements of WT moPrP (see Appendix 1).