. 2019 Jun 11;8:e46084. doi: 10.7554/eLife.46084

Figure 1. TRPA1 colocalizes with the lipid raft marker in the mobile intracellular vesicles near to the plasma membrane.

(A) Snapshot of TIRF microscopy images recorded in HEK293T cells transfected with the mTRPA1-mCherry construct (red) and stained with Vybrant Alexa Flour 488 lipid raft labeling kit (green). The third panel shows a merged image. Scale bar 10 µm. (B) Dual-color TIRF microscopy images at consecutive intervals (every 2 s) displaying the movement of mTRPA1-mCherry (red) along with lipid raft marker (green). Arrowheads indicate traced vesicles whose movements are shown in the rightmost column. Scale bar 2 µm.

Figure 1.

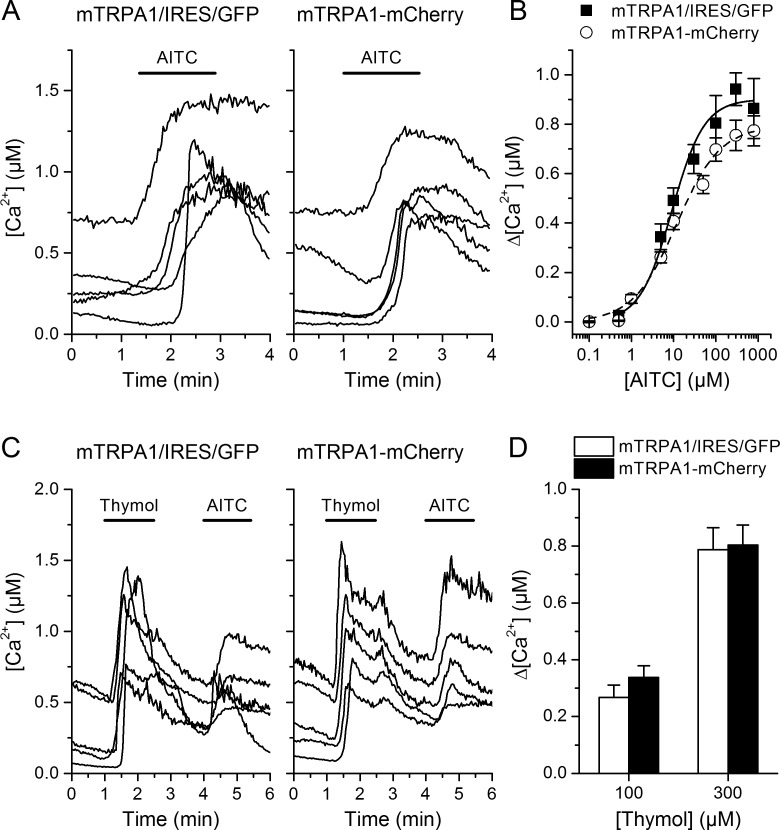
Figure 1—figure supplement 1. Intracellular calcium responses of mTRPA1 are not influenced by addition of the mCherry tag to channel C-terminus.

Figure 1—figure supplement 1.

(A) Representative traces of intracellular Ca2+ change evoked by 10 µM AITC (roughly EC50 concentration) in HEK293T cells transfected with mTRPA1 or mTRPA1-mCherry channels. (B) Dose-response relationships comparing AITC responses of mTRPA1 (black line representing fit with Hill equation) and mTRPA1-mCherry (dash fit line). Obtained EC50 concentrations were 11.7 ± 2.2 µM for mTRPA1 and 11.8 ± 2.5 µM for TRPA1-mCherry. (C) Representative traces of intracellular Ca2+ change evoked by 300 µM thymol in HEK293T cells transfected with mTRPA1 or mTRPA1-mCherry channels. (D) Average [Ca2+] amplitude change evoked by 100 µM and 300 µM thymol in cells expressing mTRPA1 or mTRPA1-mCherry. No significant changes in evoked responses were detected (n > 50 cells). Error bars represent the standard error of the mean.
Figure 1—figure supplement 1—source data 1. mTRPA1 response amplitudes and statistical analysis.
DOI: 10.7554/eLife.46084.004