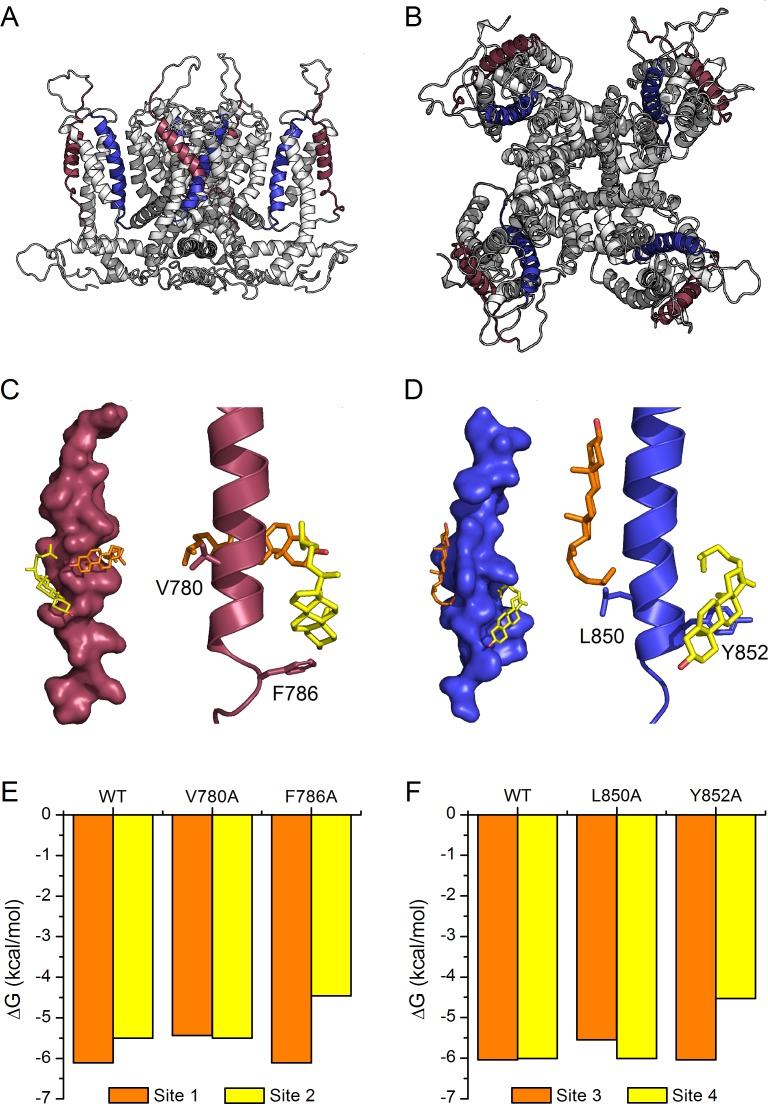
Figure 6. Model of cholesterol binding to TM2 and TM4 in TRPA1.
(A, B) Model of the mTRPA1 channel (A), side view and (B), top view) presenting localization of TM2 (colored purple) and TM4 (colored blue) segments. (C, D) Two cholesterol molecules (orange and yellow) interact simultaneously with TM2 and TM4 segments (panels C-left and D-left), a zoom-in of residues V780 and F786 (in TM2) and L850 and Y852 (in TM4) showing the close proximity of the cholesterol molecules to the side chains (panels C-right and D-right). (E, F) Calculated energies of cholesterol binding to the docking sites in the WT and mutant channels.

