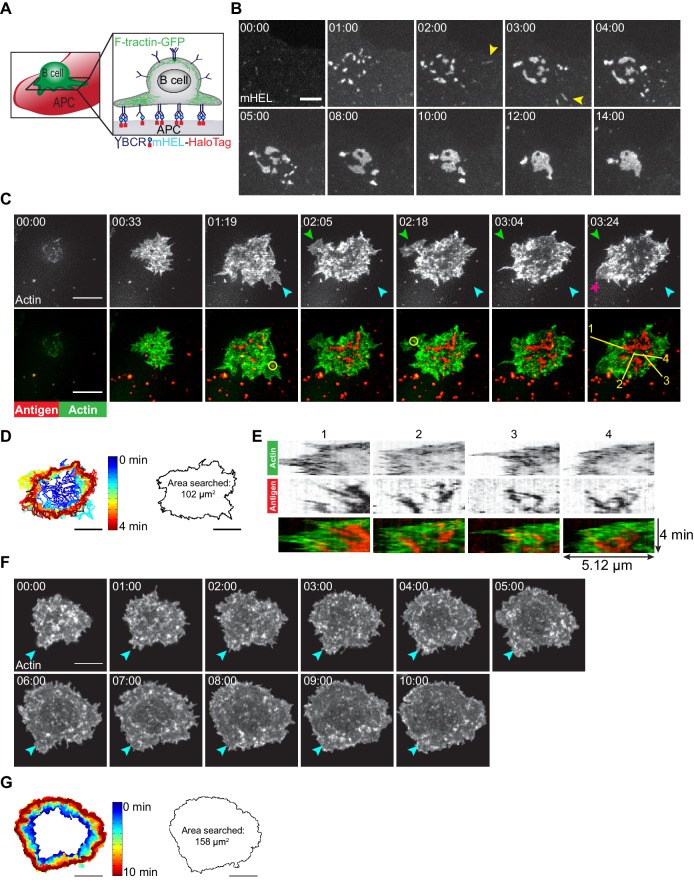
Figure 1. B cells generate dynamic actin-based probing protrusions in response to APC-bound Ags.
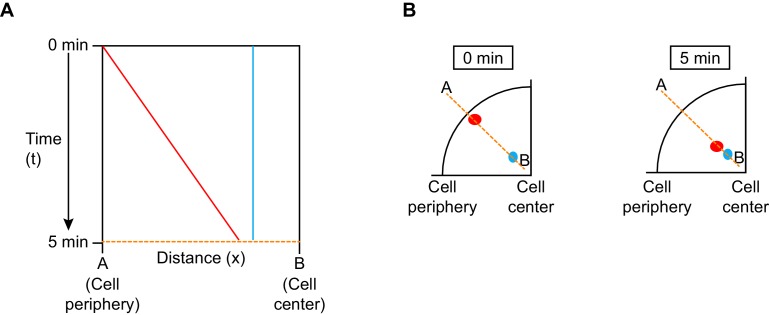
(A) Schematic of the B cell-APC system. COS-7 cells expressing mHEL-HaloTag Ag act as APCs for B cells expressing HEL-specific BCRs. (B) A20 D1.3 B cells were added to COS-7 cells expressing mHEL-HaloTag and the B cell-APC contact site was imaged every 12 s for 14 min using spinning disk microscopy. Images from Video 1 are shown. Yellow arrowheads indicate BCR-Ag microclusters that formed far from the center of the contact site. The data are representative of >40 cells from nine independent experiments. Times are shown in min:s. (C) A20 D1.3 B cells expressing F-Tractin-GFP (green) were added to COS-7 APCs expressing mHEL-HaloTag (red) and the B cell-APC contact site was imaged every 6.6 s for 4 min using ISIM. Images from Video 2 are shown. The different colored arrowheads in the upper panels (actin channel) represent membrane protrusions that were extended or retracted. The yellow circles in the lower panels indicate BCR-Ag microclusters (red) that were formed on new actin protrusions. (D) For each frame of Video 2, the cell edge, as defined by F-actin, was overlaid as a temporally-coded time series (left). The total area searched by the B cell over the 4-min period of observation is shown on the right. (E) Kymographs showing the time evolution of fluorescence signals along the yellow lines in the lower right panel of (C) depict the centripetal movement of Ag clusters and the surrounding actin structures. The velocity of a particle is proportional to the angle at which its track deviates from a vertical line along the time axis. See Figure 1—figure supplement 1 for additional explanation of kymograph analysis. (F) A20 B cells expressing F-Tractin-GFP were added to anti-IgG-coated coverslips and the contact site was imaged every 2 s for 10 min using a Zeiss Airyscan microscope. Images from Video 3 are shown. Blue arrowheads represent a long-lived membrane protrusion. (G) A temporally coded time series representing the edge of the cell (left) was generated from Video 3 and the total area searched by the B cell over the 10 min period of observation is shown (right). Scale bars: 5 µm.


