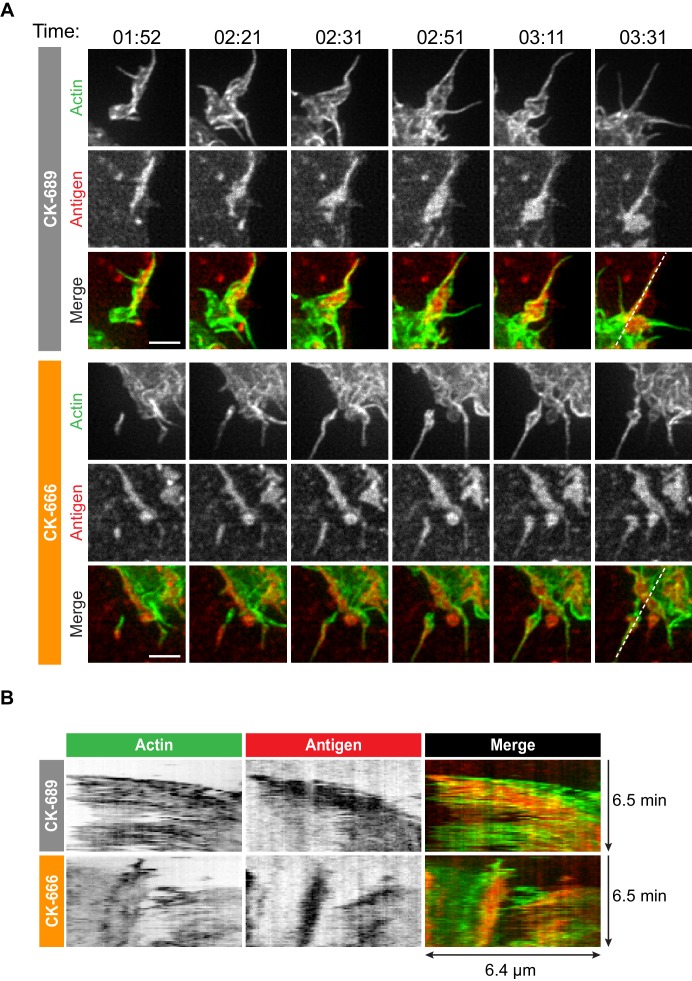
Figure 5. Arp2/3 complex-dependent actin structures encage BCR-Ag microclusters on membrane protrusions.
(A) Images from Video 10 and Video 11 showing enlargements of the regions indicated by the yellow boxes in Figure 4. A20 D1.3 B cells expressing F-Tractin-GFP (green) were pre-treated with 100 μM CK-689 or CK-666 for 1 hr and then added to COS-7 cells expressing mHEL-HaloTag (red). The cells were imaged every 6.6 s for 6 min using ISIM. Scale bars: 2 µm. (B) The kymographs represent a time series of images taken along the white dashed lines in (A).

