. 2019 Jun 3;8:e44574. doi: 10.7554/eLife.44574

Figure 9. Arp2/3 complex activity is required for B cell activation responses.

(A) Readouts used to assess B cell activation in response to anti-Igκ-expressing APCs. Primary murine B cells were pre-treated with CK-689 or CK-666 for 1 hr and then added to the APCs. The CK-689 or CK-666 was present in the co-culture for the entire length of the experiment unless otherwise indicated. (B) Histograms showing GFP fluorescence in primary ex vivo Nur77GFP B cells exposed to anti-Igκ-expressing COS-7 APCs (filled curves) or parental COS-7 cells (unfilled curves) for 3 hr. The Ag-induced increase in GFP fluorescence was calculated as the geometric mean for B cells cultured with anti-Igκ-expressing APCs (dotted line) minus the geometric mean for B cells cultured with parental COS-7 cells. See Figure 9—figure supplement 1A for gating strategy. The graph shows the Ag-induced increase in GFP fluorescence in CK-666-treated B cells as a percent of the response in CK-689-treated control cells (=100%). Each dot is an independent experiment and the red line is the median. (C,D) Histograms showing CD69 (C) or CD86 (D) upregulation in primary ex vivo C57BL/6J B cells exposed to anti-Igκ-expressing APCs (filled curves) or parental COS-7 cells (unfilled curves) for 18 hr. The Ag-induced increases in CD69 or CD86 expression were calculated as in (B). See Figure 9—figure supplement 2 for gating strategy and representative calculations. Graphs show the increase in expression in CK-666-treated B cells as a percent of the response in CK-689-treated controls (=100%). Each dot is an independent experiment. The median (red line) and interquartile ranges (box) are shown. (E) Induction of CD86 expression in response to APCs (calculated as above) or to PMA +ionomycin (geometric mean for stimulated B cells minus geometric mean for unstimulated B cells) in the same experiment. Responses by CK-666-treated B cells are expressed as a percent of those in the CK-689-treated control cells. Results from two experiments are shown along with the average (bar). (F) B cells were pre-treated with CK-689 or CK-666 for 1 hr before being added to anti-Igκ-expressing APCs or parental COS-7 cells (−60 min time point). Alternatively, the drugs were added at the same time that the B cells (0 min) were added to the APCs or parental COS-7 cells, or at 5–60 min after initiating the co-culture. The Ag-induced increase in CD69 expression after 18 hr of co-culture was calculated as above and responses by CK-666-treated B cells are expressed as a percent of those in the CK-689-treated control cells. For each point, the average ± range is shown for two experiments. (G) B cells were pre-treated with CK-689 or CK-666 for 1 hr prior to being added to anti-Igκ-expressing APCs. After 18 hr of co-culture, the percent of blast cells with increased forward and side scatter was determined by flow cytometry (see Figure 9—figure supplement 2 for gating strategy). Each dot is an independent experiment. The median (red line) and interquartile ranges are shown. (H) CFSE-labeled B cells were pre-treated with CK-689 or CK-666 for 1 hr prior to being cultured with APCs, IL-4, and BAFF for 3 days (filled curves). The unfilled curves depict CFSE dilution at Day 1. Representative data from one experiment is shown on the left and the average number of divisions per cell is indicated. The graph in the center shows the percent of live cells that had proliferated by Day 3. The percent of dead B cells that stained with 7-AAD is shown (right). Where indicated, CK-666 was added 24 hr after initiating the B cell-APC co-culture instead of 1 hr prior. In the graphs, each dot is an independent experiment and the bars indicate medians. ****p<0.0001; ***p<0.001; **p<0.01; *p<0.05; ns, not significant. Two-tailed paired t-test.

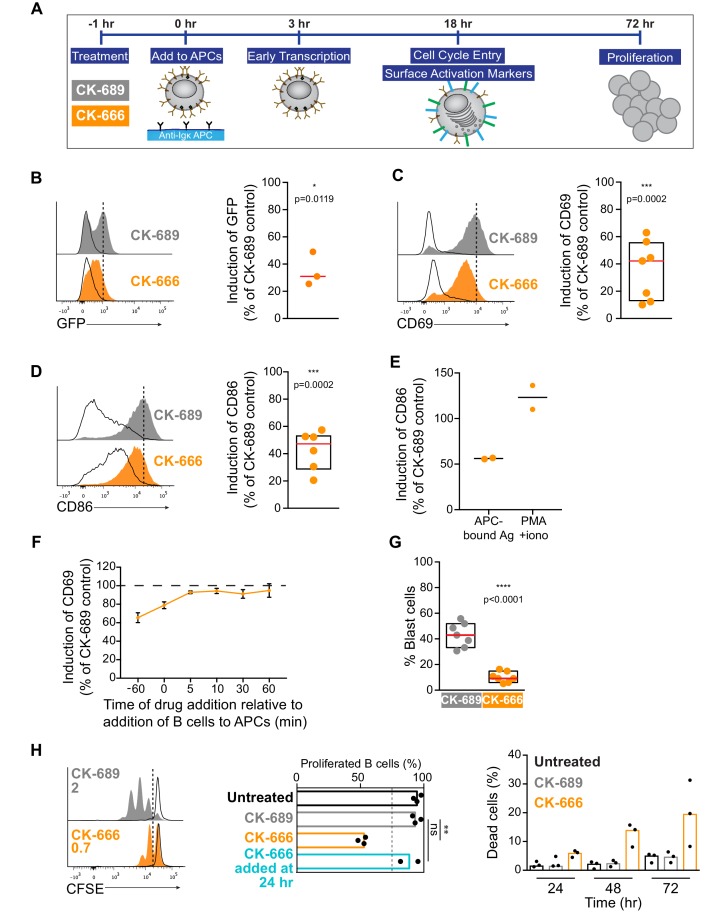
Figure 9.

Figure 9—figure supplement 1. Gating strategy for GFP expression.

Figure 9—figure supplement 1.

(A) Schematic of gating strategy. In Figure 9B, isolated primary murine B cells from Nur77GFP reporter mice were pre-treated with CK-689 or CK-666 for 1 hr. These cells were then cultured by themselves for 3 hr (No APC) or cultured with either parental COS-7 cells (No-Ag-APC) or COS-7 cells expressing membrane-bound anti-Igκ (Ag-APC) for 3 hr. The cells were then analyzed for GFP expression by flow cytometry. Lymphocytes were gated on using SSC-A and FSC-A. Single cells were gated on using FSC-W and FSC-A. The geometric mean (GM) of the GFP fluorescence was calculated for GFP+-gated cells. To quantify Ag-induced increases in GFP fluorescence, the GM for GFP + B cells that had been added to parental COS-7 APCs was subtracted from the GM of GFP+ B cells that had been added anti-Igκ-expressing COS-7 APCs. (B,C) Examples of these calculations for CK-689-treated (B) and CK-666-treated (C) B cells are shown. In Figure 9B, the Ag-induced increase in the GFP fluorescence for the CK-666-treated cells value is expressed as a percent of the corresponding value for the CK-689-treated cells.
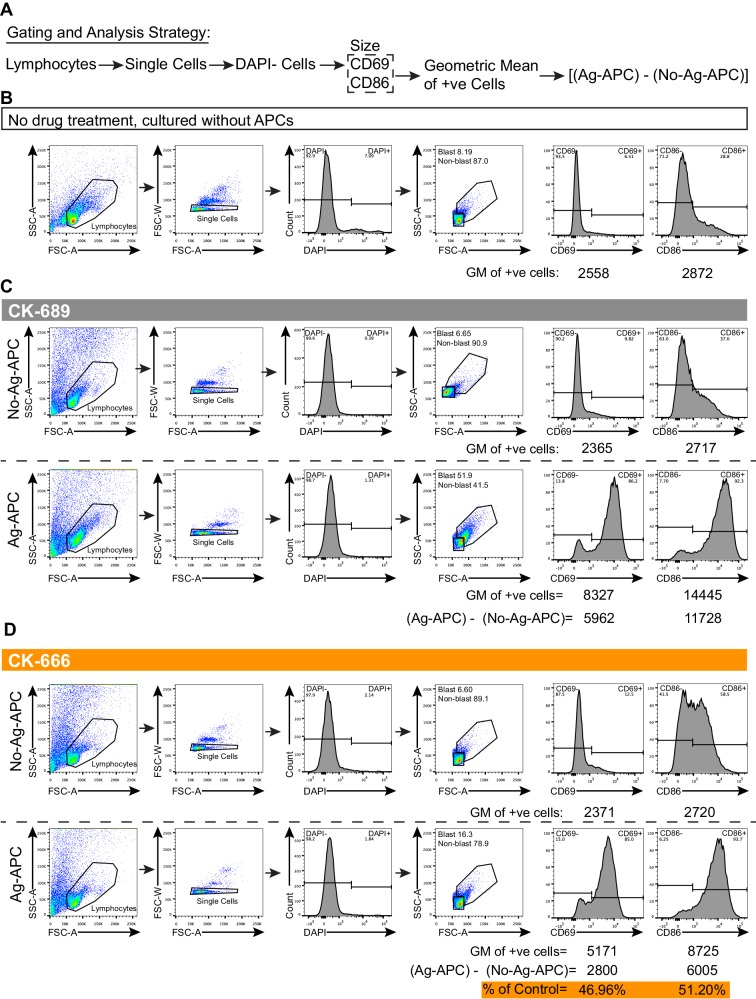
Figure 9—figure supplement 2. Gating strategy for CD69 and CD86 upregulation and blast cell formation.

Figure 9—figure supplement 2.

(A) Schematic of gating strategy. In Figure 9C–G, primary murine B cells from C57BL/6J mice were either left untreated and cultured by themselves for 18 hr, or were pre-treated for 1 hr with CK-689 or CK-666 and then cultured with either parental COS-7 cells (No-Ag-APC) or COS-7 cells expressing membrane-bound anti-Igκ (Ag-APC) for 18 hr. Lymphocytes were gated on using SSC-A and FSC-A. Single cells were gated on using FSC-W and FSC-A. Dead cells were excluded by DAPI staining. The cells were then analyzed for cell surface expression of CD69 or CD86 by flow cytometry. (B) Representative flow cytometry analysis for B cells that were left untreated and not co-cultured with APCs. (C,D) To quantify Ag-induced increases in the expression of CD69 or CD86, the GM of the CD69 +or CD86+B cells that had been added to parental COS-7 APCs was subtracted from the GM of CD69 +or CD86+B cells that had been added anti-Igκ-expressing COS-7 APCs. Examples of these calculations for CK-689-treated (C) and CK-666-treated (D) B cells are shown. In Figure 9C–F, the Ag-induced increase in the expression of CD69 or CD86 for the CK-666-treated cells is expressed as a percent of the corresponding value for the CK-689-treated cells. Blast cells were identified as SSC-Ahi and FSC-Ahi cells and the percent of DAPI-negative blast cells is graphed in Figure 9G.
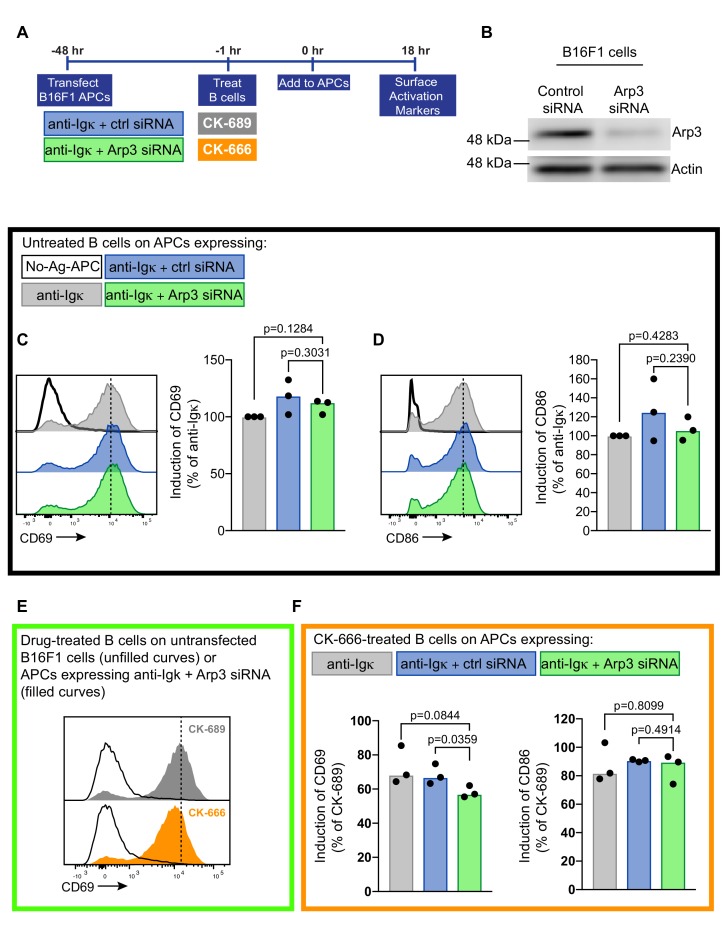
Figure 9—figure supplement 3. Depletion of the Arp2/3 complex in APCs does not affect B cell activation responses.

Figure 9—figure supplement 3.

The APCs used were untransfected B16F1 murine melanoma cells (white in panels C-F) or B16F1 cells transfected with the single chain anti-Igκ alone (grey), anti-Igκ plus control siRNA (blue), or anti-Igκ plus Arp3 siRNA (green). (A) Schematic of experimental work flow. (B) B16F1 cells that had been transfected with control siRNA or Arp3 siRNA were analyzed by immunoblotting for Arp3 and actin. Results from one representative experiment are shown. (C,D) Primary murine B cells were added to the different APC populations for 18 hr. Cell surface levels of CD69 (C) and CD86 (D) were quantified by flow cytometry. The Ag-induced increases in CD69 and CD86 fluorescence were calculated as in Figure 9C,D. The data are expressed relative to the increase in CD69 or CD86 expression stimulated by APCs that had been transfected with only the single chain anti-Igκ (the MFI for these cells is indicated by the dotted line on the histogram). Each dot represents an independent experiment and bars represent the median. (E) Primary B cells were pre-treated CK-689 (grey) or CK-666 (orange) for 1 hr and added to untrasfected (No-Ag-APC) B16F1 cells (unfilled curves) or B16F1 cells that had been transfected with single chain anti-Igκ plus Arp3 siRNA (filled curves). The MFI for CK-689-treated cells that were added to Ag-bearing Arp3 siRNA-transfected APCs is indicated by the dotted line. (F) CK-666-treated B cells were added to B16F1 APCs expressing membrane-bound anti-Igκ alone (grey filled bar), anti-Igκ plus control siRNA (blue filled bar), or anti-Igκ plus Arp3 siRNA (green filled bar). Ag-induced increases in CD69 and CD86 expression were calculated as in Figure 9C,D. Each dot represents one independent experiment and bars represent the median. Two-tailed paired t-test.
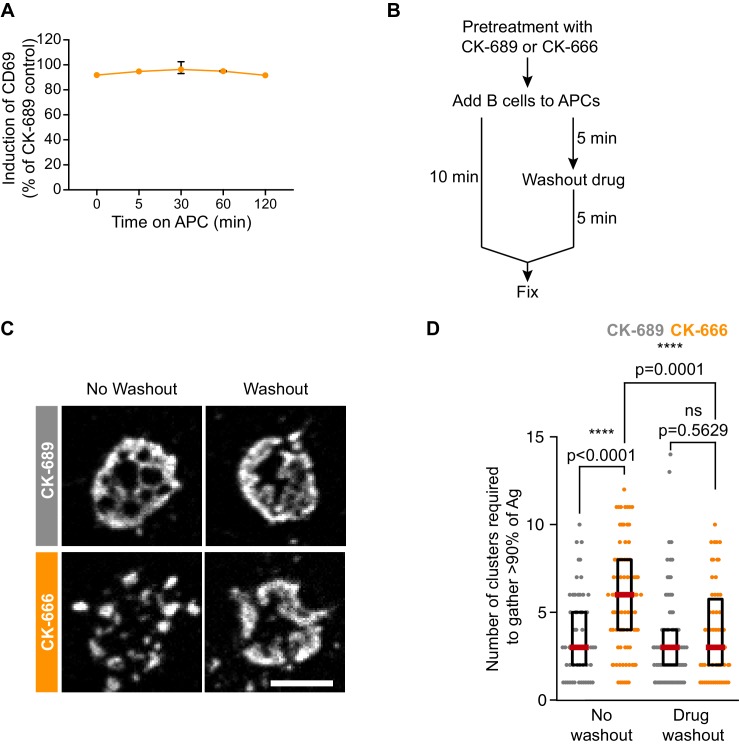
Figure 9—figure supplement 4. Washout of CK-666 allows normal APC-induced upregulation of CD69 and cSMAC formation.

Figure 9—figure supplement 4.

(A) Primary murine B cells were treated with CK-689 or CK-666 for 1 hr and then added to COS-7 APCs expressing membrane-bound anti-Igκ (Ag-APC) or to parental COS-7 cells (No-Ag-APC). The culture medium was removed at the indicated times after adding the B cells to the APCs and replaced with medium lacking CK-689 or CK-666. For t = 0, the drugs were washed out immediately before adding the B cells to the APCs. After 18 hr, the cells were stained and analyzed for cell surface expression of CD69 as in Figure 9—figure supplement 2. The increase in CD69 expression in CK-666-treated B cells is expressed as a percent of that for cells that were treated with CK-689 in the identical manner. For each point, the average ±range is shown for two experiments. Where no error bars are shown, they were smaller than the symbol. (B–D) A20 D1.3 B cells were pre-treated with 100 µM CK-689 or CK-666 for 1 hr and then added to COS-7 APCs expressing mHEL-HaloTag. These ‘no washout’ cells were fixed after 10 min of B cell-APC contact. Alternatively, B cells were added to the APCs and after 5 min of contact the drug-containing medium was washed out and replaced with fresh medium (Drug washout). After another 5 min, the cells were fixed. Cells were imaged by spinning disk microscopy (C). Representative images are shown. For each cell, the number of clusters required to contain 90% of the Ag fluorescence was calculated and graphed in (D). Each dot represents one cell and the median (red line) and interquartile ranges (black box) are shown for n>25 cells per condition. Representative data from one of two independent experiments. The Mann-Whitney U test was used to calculate p values. ****p<0.0001; ***p<0.001; **p<0.01; *p<0.05. Scale bars: 5 µm.
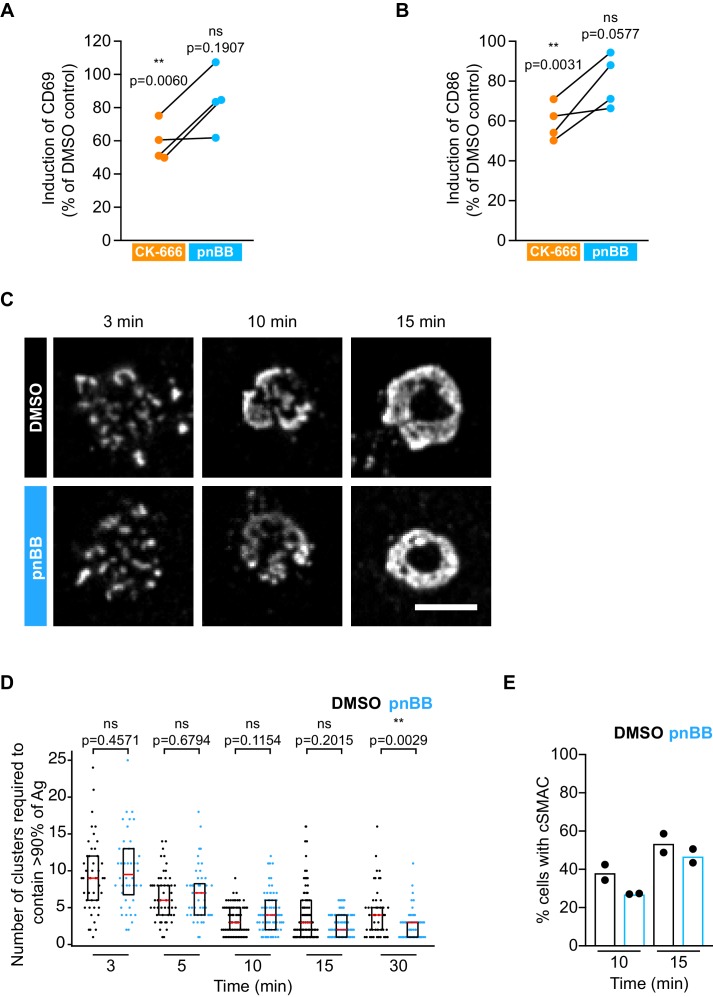
Figure 9—figure supplement 5. Inhibition of myosin does not affect upregulation of B cell activation markers or cSMAC formation.

Figure 9—figure supplement 5.

(A,B) Primary murine B cells were pre-treated with DMSO (control), 50 μM pnBB for 30 min or 100 μM CK-666 for 1 hr and then added to COS-7 APCs expressing anti-Igκ for 18 hr. Cell surface levels of CD69 (A) and CD86 (B) were quantified by flow cytometry. The Ag-induced increases in CD69 and CD86 fluorescence were calculated as in Figure 9C,D. Graphs show the increase in expression in CK-666-treated and pnBB-treated B cells as a percent of the response in DMSO-treated controls (=100%). Each dot represents an independent experiment. (C–E) A20 D1.3 B cells were pre-treated with DMSO (control) or 50 μM pnBB for 30 min and then added to COS-7 APCs expressing mHEL-HaloTag. The cells were then fixed at the indicated times and imaged by spinning disk microscopy (C). Representative images are shown. For each cell, the number of clusters required to contain >90% of the Ag fluorescence was calculated and graphed in (D). Each dot represents one cell and the median (red line) and interquartile ranges (black box) are shown for n>57 cells per condition. The percent of cells for which > 90% of the total Ag fluorescence intensity was contained in one or two clusters is graphed in (E).
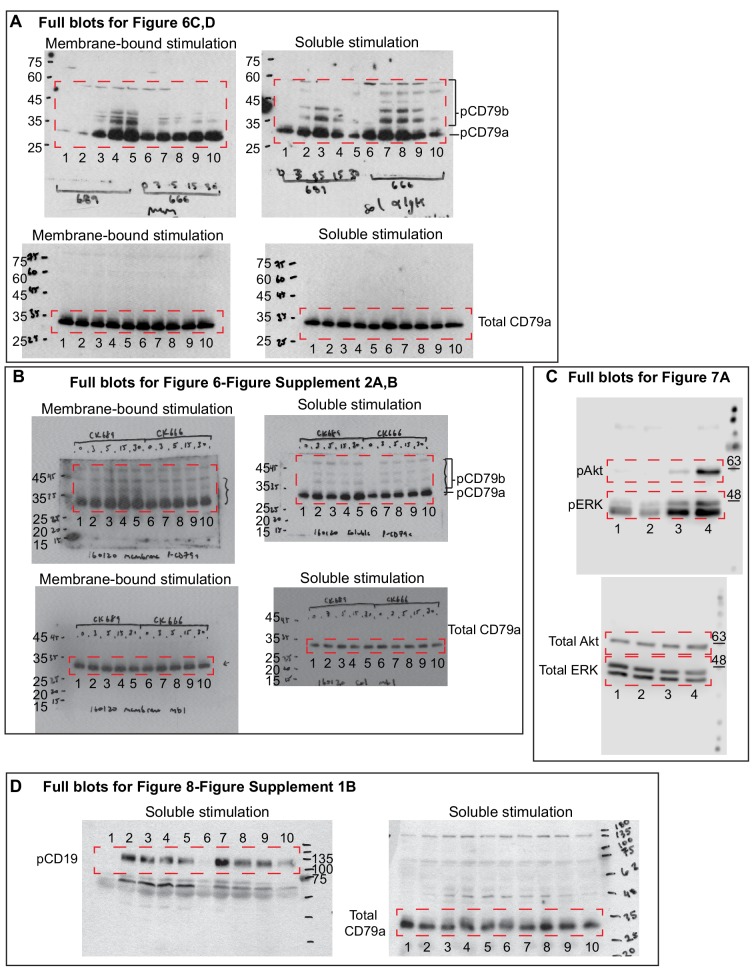
Figure 9—figure supplement 6. Images of full blots.

Figure 9—figure supplement 6.

Images of blots that were cropped for presentation in Figure 6, Figure 6—figure supplement 2, Figure 7 and Figure 8—figure supplement 1 are shown. The portions of the blots that were shown in the indicated figures are outlined by a red dashed box. Molecular weight markers are shown in kDa. (A) Full blots for Figure 6C and Figure 6D. Primary murine B cells were pre-treated with CK-689 (lanes 1–5) or CK-666 (lanes 6–10) for 1 hr then stimulated with COS-7 APCs expressing anti-Igκ (left) or with soluble anti-Igκ (right) for 0, 3, 5, 15 or 30 min. The upper blots were probed with anti-pCD79 antibodies and the lower blots with anti-CD79a antibodies. (B) Full blots for Figure 6—figure supplement 2, an additional independent experiment carried out as in (A). (C) Full blots for Figure 7A. Primary murine splenic B cells were treated with DMSO (lane 1), CK-689 (lane 2), CK-666 (lane 3) for 1 hr, or stimulated with anti-Igκ antibodies for 5 min (lane 4). The blots were probed with anti-pAkt plus anti-pERK antibodies (upper blot) or with anti-ERK plus anti-Akt antibodies (lower blot). (D) Full blots for Figure 8—figure supplement 1B. Primary murine B cells were pre-treated with CK-689 (lanes 1–5) or CK-666 (lanes 6–10) for 1 hr then stimulated with soluble anti-IgΚ for 0, 3, 5, 15 or 30 min. The left blot was probed with anti-pCD19 antibodies and the right blot with anti-CD79a antibodies as a loading control.