
Figure 2.
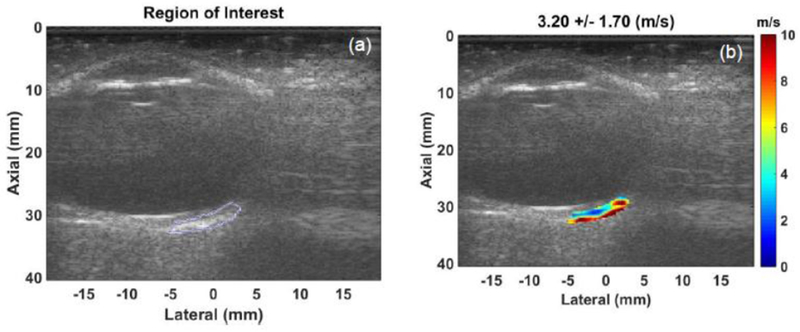
Representative selected temporal region of posterior sclera of a patient (a) and corresponding calculated wave speed (b) using speed map analysis.
Official websites use .gov
A
.gov website belongs to an official
government organization in the United States.
Secure .gov websites use HTTPS
A lock (
) or https:// means you've safely
connected to the .gov website. Share sensitive
information only on official, secure websites.
Representative selected temporal region of posterior sclera of a patient (a) and corresponding calculated wave speed (b) using speed map analysis.