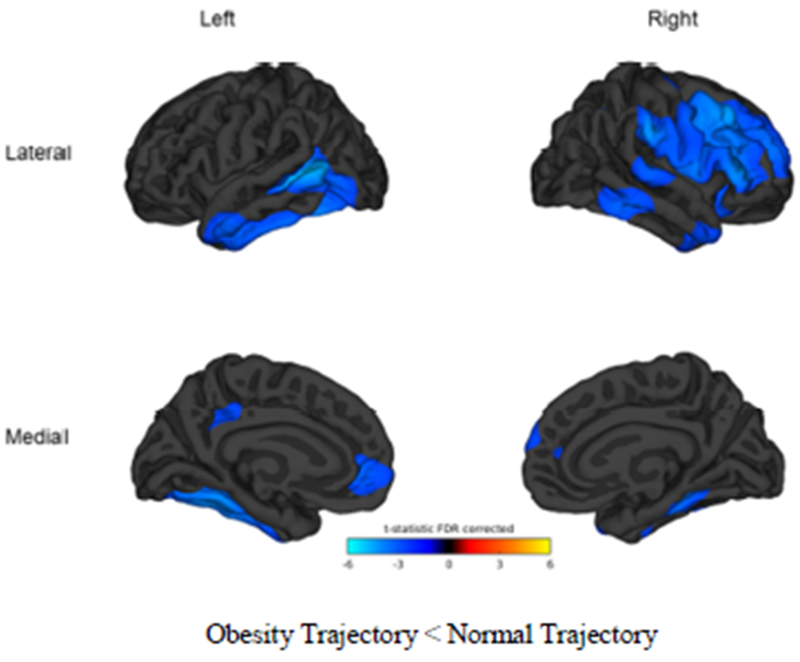
Figure 2.
Vertex-wise comparisons by trajectory group. Blue color tones indicate areas in which the obesity trajectory is significantly thinner than the normal trajectory (t-test threshold > 2). Comparisons are significant at p<0.05, FDR corrected. Cortical vertex-wise analysis in conducted in Matlab r2014a using the Matlab FreeSurfer and Statistical toolboxes. Cortical thickness maps for each hemisphere were concatenated and a general linear mixed model was run contrasting the BMI trajectories (different intercept, different slope) while controlling education, ethnicity, age, risk for dyslipidemia, hypertension, diabetes, ischemic heart disease, and scanner. To improve sensitivity and signal to noise ratio, a 30 mm full wide half maximum smoothing kernel was applied as recommended (Lerch and Evans, 2005). Significance was set at p<.05 (FDR-corrected) for clusters larger than 100 voxels and statistic maps were rendered over the FreeSurfer average brain.

