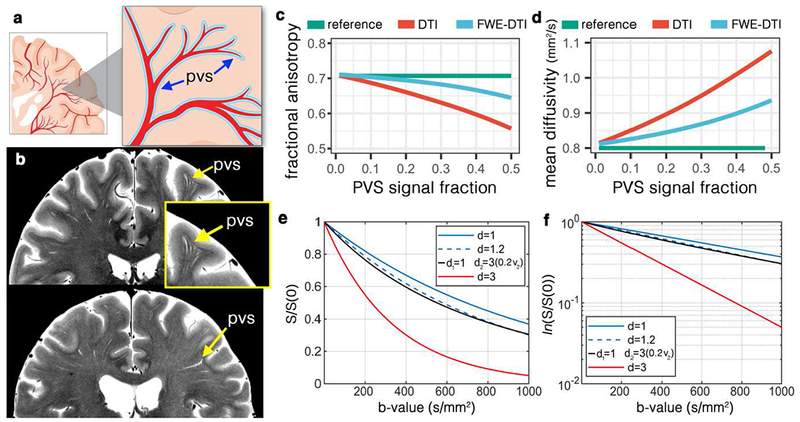
Figure 1. Perivascular space fluid (PVS) and its bias on diffusion tensor imaging (DTI).

(a) Schematic view of the PVS. (b) High-resolution turbo spin echo images of two healthy volunteers (above: 32yr old female, below: 56yr old female), scanned at 7T. In-plane resolution of 0.3mm (interpolated to 0.15mm) was used to acquire the data (with the slice thickness of 2mm). Four averages were acquired to ensure high signal-to-noise ratio. Note that PVS presents throughout the white matter, with larger diameter PVSs closer to the cortex and smaller diameter as it penetrates deep into the white matter. Systematic bias from PVS on DTI was simulated for the fractional anisotropy (c) and mean diffusivity (d). As PVS increases the amount of bias amplifies. Free-water elimination (DTI-FWE) technique is also included, which is also affected by PVS presence but to a smaller extent. A plot of diffusion MRI signal for 3 different examples of mean diffusivity (d=1 μm2/ms, blue line; d=1.2 μm2/ms, blue dashed line; and d=3 μm2/ms, red line) is illustrated in (e) and the log of the signal is plotted in (f). Note that an increased mean diffusivity from 1 μm2/ms to 1.2 μm2/ms has a similar signal profile as a scenario with no increased diffusivity but 20% of PVS presence (i.e. PVS signal fraction of 0.2; black line).
