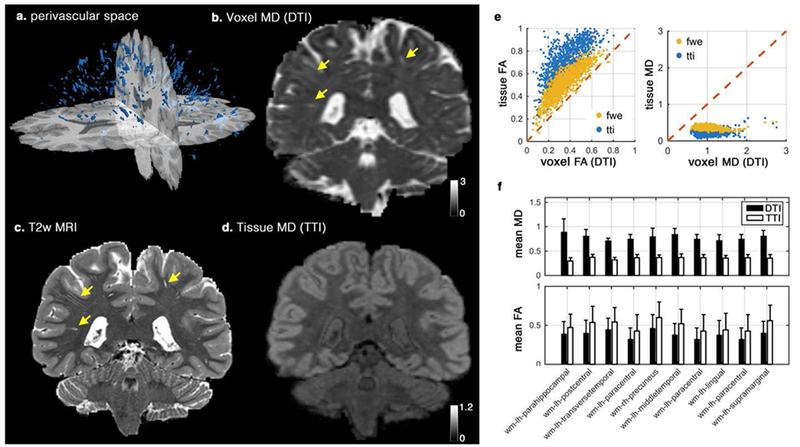
Figure 3. Investigating the effect of the perivascular space (PVS) on DTI in single subject level.

Segmented PVS voxels of a healthy subject from human connectome project is plotted in (a). Voxel mean diffusivity (MD) derived using DTI, T2-weighted image, and Tissue MD derived from tissue tensor imaging (TTI) are plotted (b-d), respectively. Note that the expected white matter homogeneity is preserved in tissue MD map, while voxel MD is largely affected by the PVS contribution (extreme cases are demonstrated by yellow arrows). Correlation of the voxel values and the tissue values that were derived from DTI and TTI are plotted in (e). Values from free water elimination (FWE) technique are included for comparison. Mean values of MD and FA from DTI and TTI across 10 white matter regions are also plotted (f). All differences of MD and FA mean values in (f) are significant at p<0.001 (using a paired t-test). Diffusivity values are in μm2/ms.
