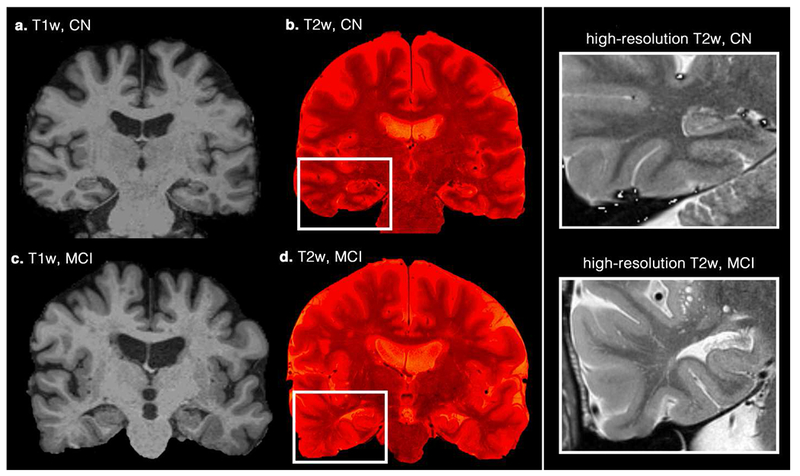
Figure 6. Examples of differing perivascular space (PVS) concentration on a cognitively normal (CN) subject and a patient with mild cognitive impairment (MCI) diagnosis.

Coronal T1-weighted images (a and c) are illustrated. High-resolution T2-weighted images were superimposed on them to highlight the PVS (b and d). Right column figures zoomed into the temporal lobe area, in which increased mean diffusivity and decreased fractional anisotropy are commonly reported.
