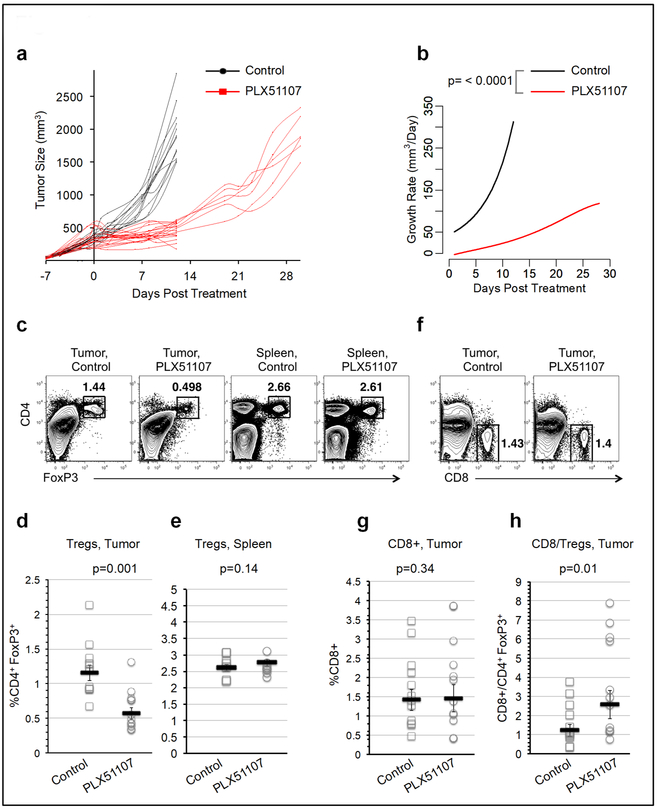
Figure 1: PLX51107 treatment effect on murine melanoma tumor growth and tumor infiltrating T cells.
(a) YUMM1.7 murine melanoma tumors were generated in C57BL/6 hosts. When tumor sizes reached 200-500 mm3, recipients were placed on either control chow (black) or PLX51107-laced chow (red). Tumor volumes were monitored at the indicated time points. Each line corresponds to an individual mouse. (b) The corresponding tumor growth rate functions are shown. (c) Mice were sacrificed after 12 days of treatment. Spleens and tumor cells were homogenized and analyzed by flow cytometry. CD4+, FoxP3+ Treg frequencies within the (d) bulk tumor or (e) spleen cells were compared in control versus treated mice. (f) CD8+ cells were gated in tumors and (g) the frequencies of CD8+ cells and (h) the CD8+/Tregs ratios in tumors were compared. Each symbol represents an individual mouse.

