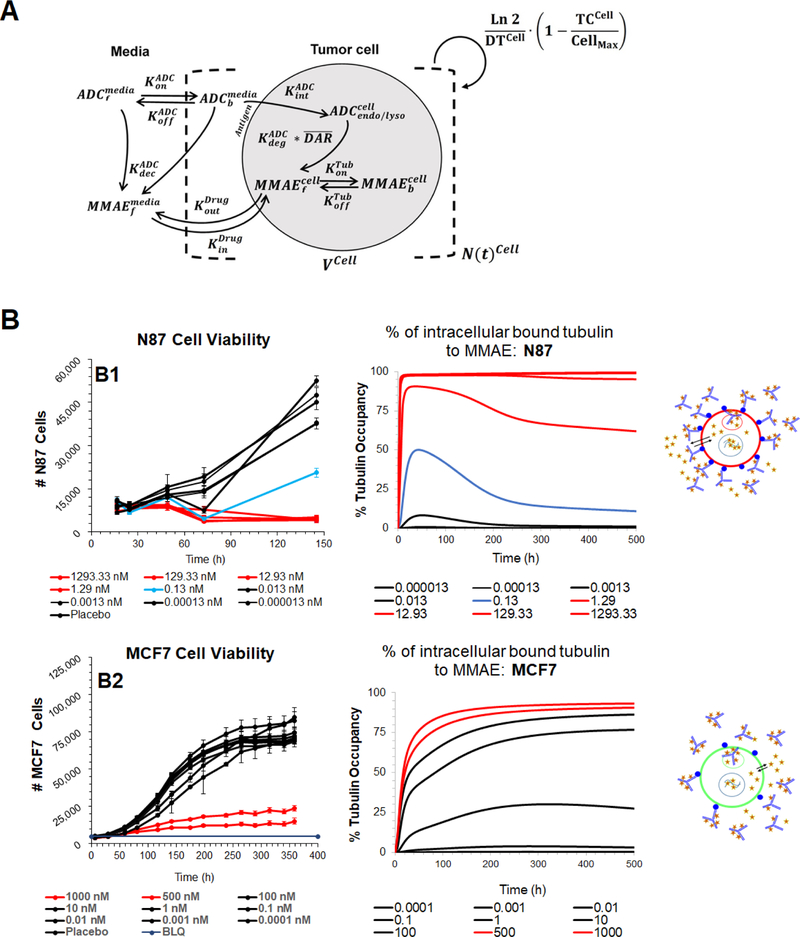
Figure 1.
(A) Schematic of the single cell-level PK model for T-vc-MMAE ADC. (B) Comparison of model simulated MMAE induced intracellular tubulin occupancy at various T-vc-MMAE concentrations (in nM) with the observed cell cytotoxicity (17) at similar concentrations. B1 represents N87 cells and B2 represents GFP-MCF7 cells. Lines have been color coded to visually segregate the groups that show different extent of cytotoxicity and % tubulin occupancy.

