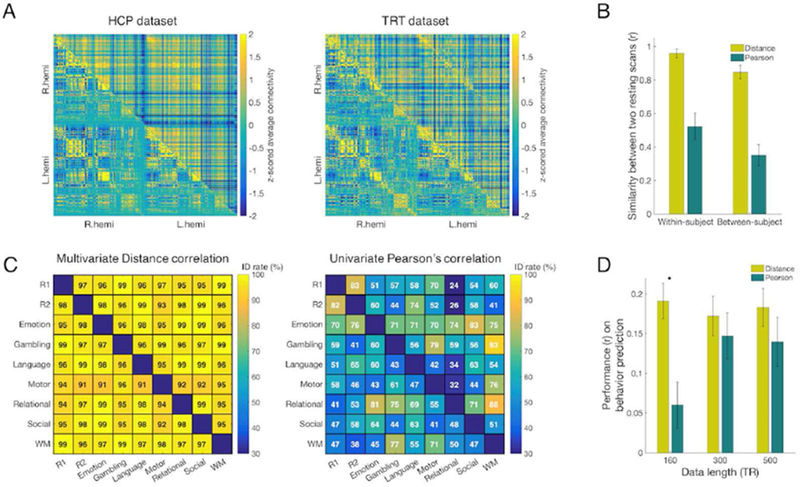
Figure 2. The whole-brain functional connectome shows both similar and distinct features across multivariate and univariate connectivity estimates.
A) Left: Group-averaged resting-state connectomes constructed by multivariate distance correlation (upper triangle) and by Pearson’s correlation (lower triangle) in the Human Connectome Project (HCP) dataset. Connectomes were first constructed for each run for each subject, and then averaged across runs and subjects to generate the group average. Right: The same resting-state connectome in the test-retest (TRT) dataset. B) Within- and between-subject similarity in the HCP set. All similarity values (error bar=standard deviation) assessed with Pearson’s spatial correlation are significant (p < 1×10⁻⁵). Similarity via multivariate connectivity is significantly different than and similarity via univariate connectivity (p < 1×10⁻⁵). Between-subject similarity was estimated twice, once for each of the two resting scans, and then averaged. C) Identification with connectome fingerprinting in the HCP dataset. In each matrix plot, the lower triangular and upper triangular represent opposite directions of a ‘target’-‘database’ pair. Since two directions of a ‘target’-‘database’ pair give different identification results, the identification success rate matrices are asymmetric. Distance correlation connectomes provided identification success rates of 96.6% and 97.5% between two resting scans. In comparison, Pearson’s correlation connectomes gave identification success rates of 83.3% and 81.5% between the same two resting scans. Across all pairs of brain states, the identification success rates of distance correlation ranged from 91% to 99%, whereas the identification success rates of Pearson’s correlation ranged from ~30% to 93%. For every pair of fMRI scans, connectomes constructed using distance correlation (left) showed higher identification success rates than connectomes generated with Pearson’s correlation (right). R1 and R2 represent the 1st and the 2nd resting scans, respectively. WM represents the working memory task scan. This analysis was performed within the HCP sample. D) Prediction of individual fluid intelligence using different fMRI scan lengths (160, 300, 500 TRs) in the HCP dataset. CPM models were built using multivariate or univariate connectivity. Model performance is assessed as the Pearson correlation between predicted and observed fluid intelligence scores. Error bar represents standard deviation from 5,000 iterations of randomly assigned 10-fold cross validation. (*significant difference with p<0.01)

