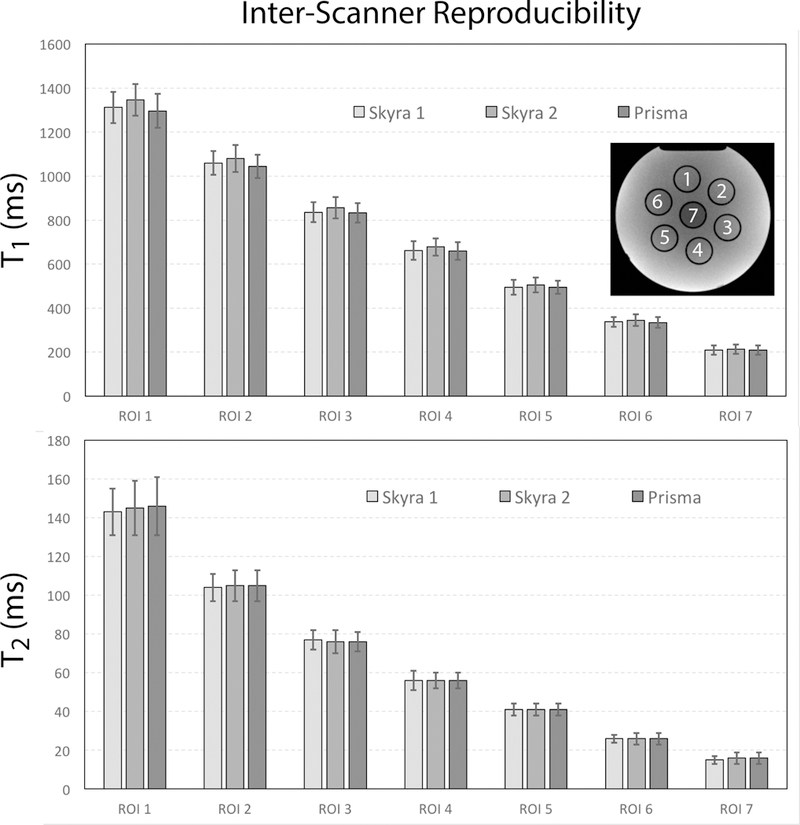
Figure 3.

Average T1 and T2 values in seven phantom compartments with decreasing relaxation times. Error bars show the standard deviation within the regions of interest (ROI) for each compartment. Values were calculated for an axial slice through the center of the phantom, which is shown in the upper right corner, together with the different compartments.
