Figure 5.

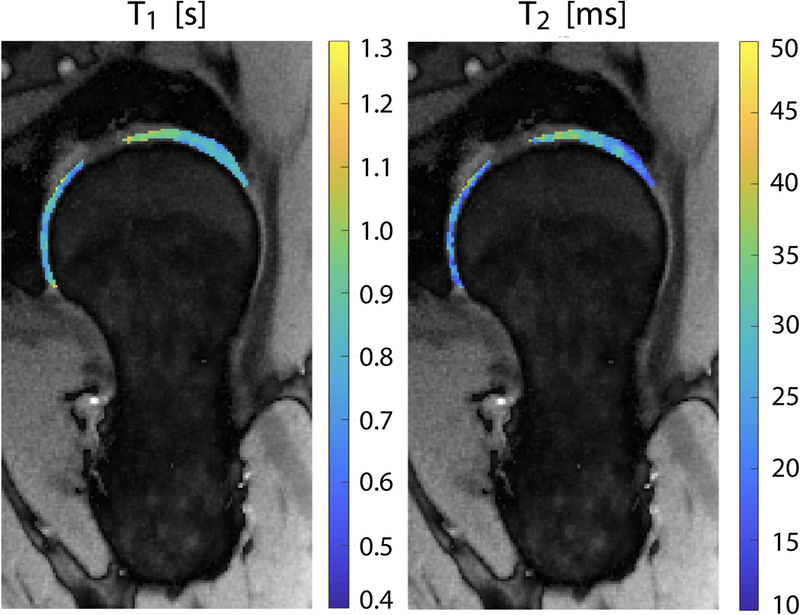
Spatial distribution of cartilage T1 and T2 for a representative radial section of the hip. Articular cartilage was segmented using a semi-automatic procedure and superimposed to the corresponding proton density map.

Spatial distribution of cartilage T1 and T2 for a representative radial section of the hip. Articular cartilage was segmented using a semi-automatic procedure and superimposed to the corresponding proton density map.