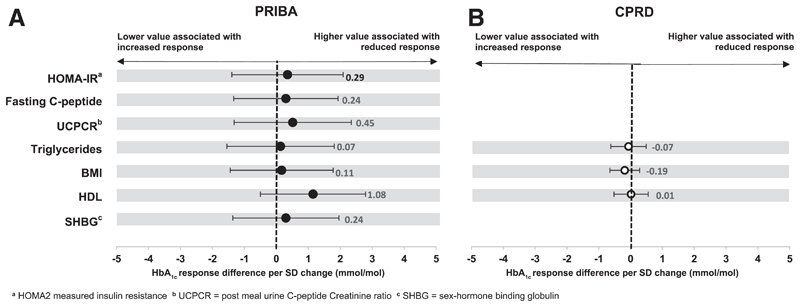
Figure 3. GLP-1 receptor agonists - associations between markers of insulin resistance and HbA1c response at 6 months.
Circles (black = PRIBA, white = CPRD) denote the mean HbA1c change (mmol/mol) at 6 months per 1 standard deviation (SD) higher baseline value of each marker. Error bars denote 95% confidence intervals.

