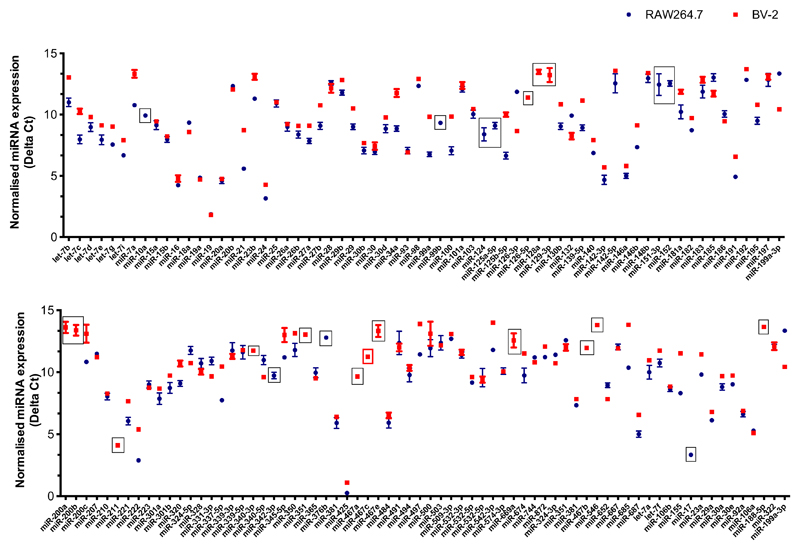
Figure 1. Comparison of miRNA expression profiles in MNV1-infected murine macrophage RAW264.7 cells and microglial BV-2 cells.
RAW264.7 and BV-2 cells were infected with MNV-1 at an MOI of 0.1 TCID50/cell. The small RNA fraction was harvested at 20 hpi. Reverse transcription was performed using a set of primers for 380 miRNAs and control small RNAs, followed by qPCR analysis using TLDA miRNA cards. Results for the 136 detectable miRNAs are shown. The Ct for each specific miRNA is normalised against the Ct of the U6 control RNA to give the Delta Ct value shown on the Y-axis. The higher the Delta Ct the lower the expression. Boxed points indicate miRNAs that are expressed in only one of the cell lines during MNV-1 infection, the red box indicated miR-467c.

