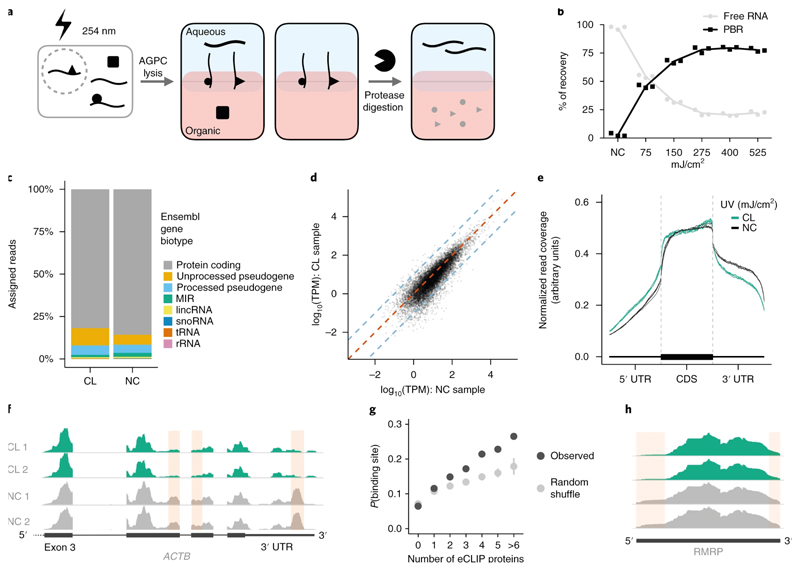
Figure 1. OOPS recovers protein-bound RNAs.
(a) Schematic representation of the OOPS method to extract protein-bound RNA. Cells are crosslinked to induce RNA-proteins adducts which are drawn simultaneously to the organic and aqueous phases in Acid Guanidinium-Phenol-Chloroform (AGPC) and thus remain at the interface. Protease digestion and a further AGPC separation yields RNA in the aqueous phase.
(b) Relative proportions of free RNA (aqueous phase) and protein-bound RNA (PBR; interface) with increasing UV dosage. Data shown as mean +/- SD of 3 independent experiments.
(c) Relative proportions of RNA-Seq reads assigned to Ensembl gene biotypes for 400 mJ/cm2 CL and NC samples.
(d) Correlation between gene abundance estimates for NC replicate 1 and 400 mJ/cm2 CL replicate 1. Blue dashed lines represent a 10-fold difference. Red dashed line represents equality.
(e) Meta-plot of read coverage over protein-coding gene-model. Reduced coverage observed for 400 mJ/cm2 CL samples in the 3' UTR.
(f) Read coverage across ACTB for CL (400 mJ/cm2) and NC replicates. Red boxes denote regions with consistently reduced coverage in CL.
(g) Relationship between the number of eCLIP proteins with a peak in a sliding window and the probability of the window being identified as a protein binding site. For random shuffle, the center value is the mean and error bar is 2 standard deviations, n = 100 iterations.
(h) Read coverage across RMRP for CL (400 mJ/cm2) and NC replicates. Red boxes denote regions with consistently reduced coverage in CL.
Non-crosslinked=NC, Crosslinked=CL.

