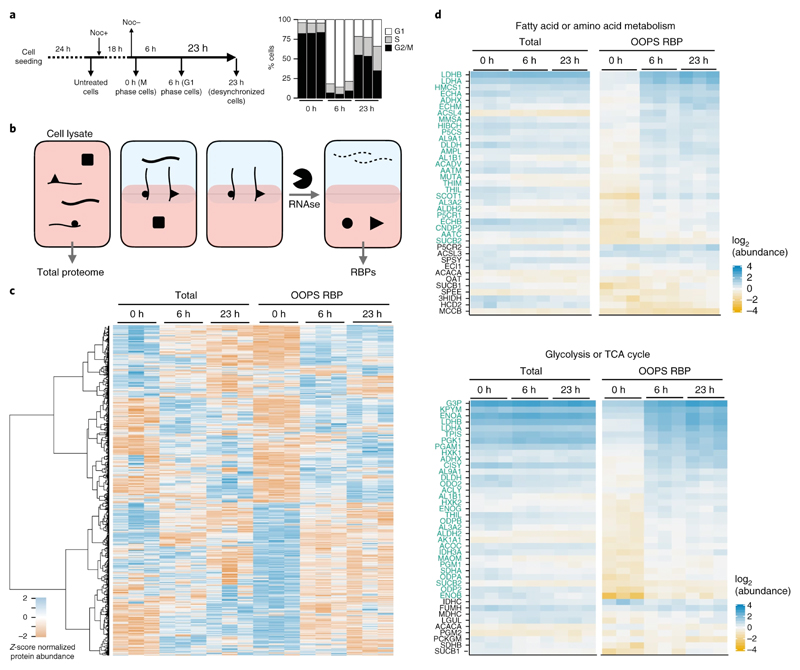
Figure 5. RBP-ome after nocodazole arrest.
(a) Left: schematic representation of the nocodazole arrest/release experiment. Cells were analysed after 18 h nocodazole arrest and after a 6 h or 23 h release from the treatment release. Right: relative proportions of cells in G1, S and M phase for cells synchronised at each time-point (shown as the mean +/- SD of 3 independent experiments)
(b) Schematic representation of protein extraction for nocodazole-arrest experiment. Total proteomes were extracted from cell lysates and RBPs were extracted following OOPS proteome method.
(c) Protein abundance from total proteome and OOPS extractions. Abundance z-score normalised within each extraction type. Proteins hierarchically clustered across all samples as shown on left
(d) Protein abundance for groups of overlapping KEGG pathways over-represented in proteins with a significant increase in RNA-binding at 6 h vs 0 h. Individual proteins with a significant increase in RNA binding in 6 h vs 0 h are highlighted in green

