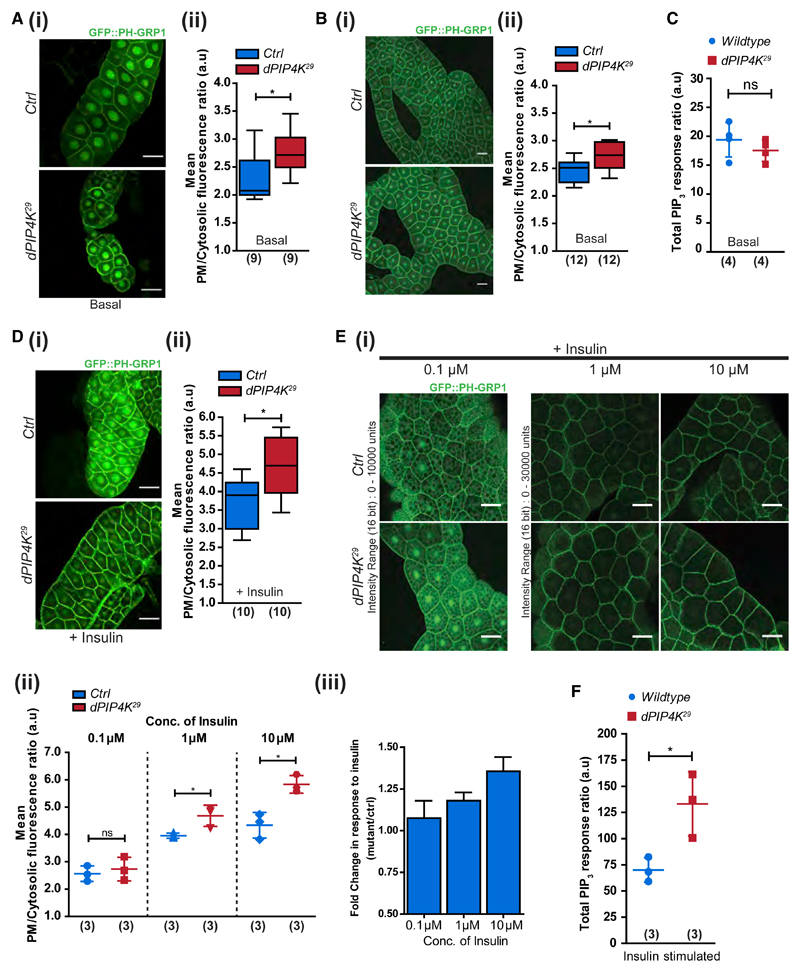
Figure 1. Loss of PIP4K Increases PIP3 Levels.
(A and B) Representative confocal images with the distribution and quantification of PIP3 levels using GFP::PH-GRP1 probe in (Ai and Aii) larval salivary glands and (Bi and Bii) larval fat body. Scale bars: 50 μm in salivary gland images; 10 μm in fat body images.
(C) Total PIP3 levels using LCMS in whole larval lipid extracts.
(D) Confocal z-projections depicting PIP3 levels in (i and ii) insulin-stimulated (10 μM insulin, 10 min) salivary glands.
(E) Fat body lobes stimulated with 0.1, 1, and 10 μM insulin after 2-h starvation. Scale bars: 50 μm. (iii) Mean fold change in response to insulin (from data in ii).
(F) Total PIP3 levels using LCMS in insulin-stimulated whole larval lipid extracts.
Boxplots with whiskers at minimum and maximum values, a line at the median, and scatterplots with mean ± SD are shown. Numbers in parentheses below the plots indicate the number of biological replicates. Statistical tests: (A, B, and D) Mann-Whitney test and (C, E, and F) Student’s unpaired t test. *p value < 0.05. See also Figures S1 and S2.

