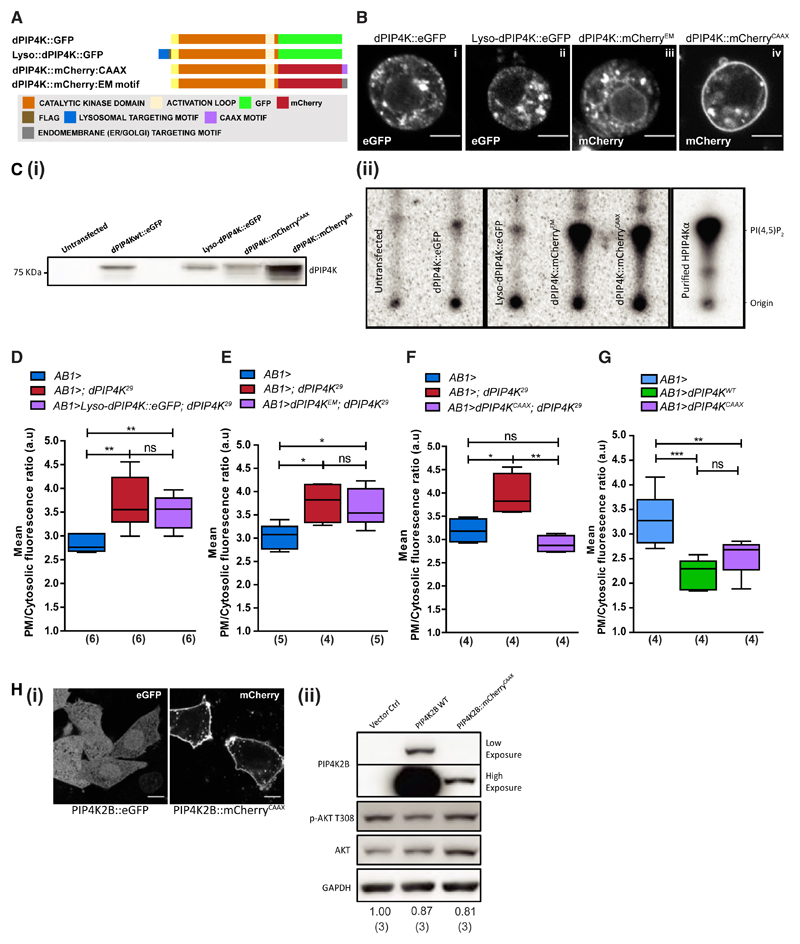
Figure 3. PIP4K Acts at the Plasma Membrane to Regulate Insulin-Stimulated PIP3 Production.
(A) Constructs targeting dPIP4K to different subcellular compartments.
(B) Confocal z-projections of S2R+ cells expressing (i) wild-type dPIP4K::eGFP, (ii) lysosome-targeted dPIP4K::GFP (Lyso-dPIP4K::eGFP), and dPIP4K::mCherry targeted to (iii) endomembranes (dPIP4K::mCherryEM− ER, Golgi, and endo-lysosomal system) and (iv) plasma membrane (dPIP4K::mCherryCAAX).
(C) (i) Immunoblots from S2R+ lysates expressing indicated dPIP4K constructs used in the in vitro assay. (ii) In vitro PIP-kinase assay for different dPIP4K constructs from S2R+ cell lysates.
(D–G) PIP3 measurement using the PH-GFP-GRP1 probe in insulin-stimulated (10 μM) dPIP4K29 salivary glands reconstituted with (D) Lyso-dPIP4K::eGFP, (E) dPIP4K::mCherryEM, and (F) dPIP4K::mCherryCAAX, and (G) overexpression of wild-type dPIP4K and dPIP4K::mCherryCAAX.
(H) (i) Representative confocal z-projections of CHO-IR cells expressing GFP-PIP4K2B and PIP4K2B::mCherry-CAAX. Scale bars: 10 μm. (ii) Immunoblots for pAKT from insulin-stimulated (1 μM, 10 min) CHO-IR cells.
Numbers below the blots are mean pAKT/Tot-AKT ratios from three independent experiments. Boxplots with whiskers at minimum and maximum values and a line at the median are shown. Numbers in parentheses below the plots indicate the number of biological replicates. Statistical tests: (D–G) one-way ANOVA with post hoc Tukey’s multiple pairwise comparison. *p value < 0.05; **p value < 0.01. See also Figures S3 and S4.

