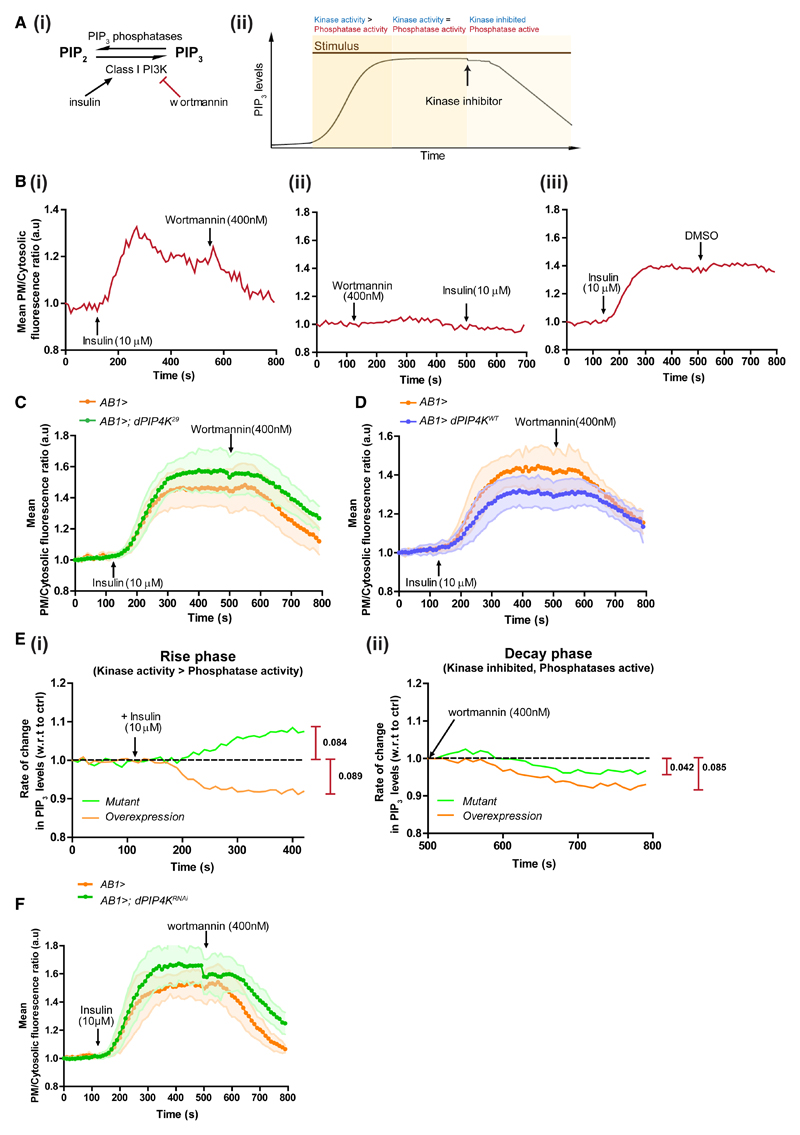
Figure 4. dPIP4K Alters PIP3 Turnover by Limiting Class I PI3K Activity.
(A) (i) Reactions influencing PIP3 turnover at the plasma membrane. Insulin activates PI3K, and wortmannin irreversibly inhibits PI3K. (ii) Three phases in the live-imaging assay to follow PIP3 dynamics.
(B) Single live-imaging traces of plasma membrane/cytosolic PIP3 probe fluorescence ratio from salivary glands expressing GFP::PH-GRP1.
(C and D) Comparison of average live-imaging traces of PIP3 probe fluorescence ratios in (C) control and dPIP4K29, and (D) control and dPIP4K overexpression salivary glands (N = 7 imaging runs for all genotypes, minimum of about nine cells analyzed from each run). Error bars: SD. Controls were repeated as the two experiments were performed at different times.
(E) Normalized differences in instantaneous rate of change in fluorescence (ratio of test to that in controls); maximal difference is indicated alongside.
(F) PIP3 levels in wild-type and dPIP4K-overexpressing salivary glands. Live salivary gland PIP3 dynamics upon knockdown of dPIP4K.
See also Figure S5.

