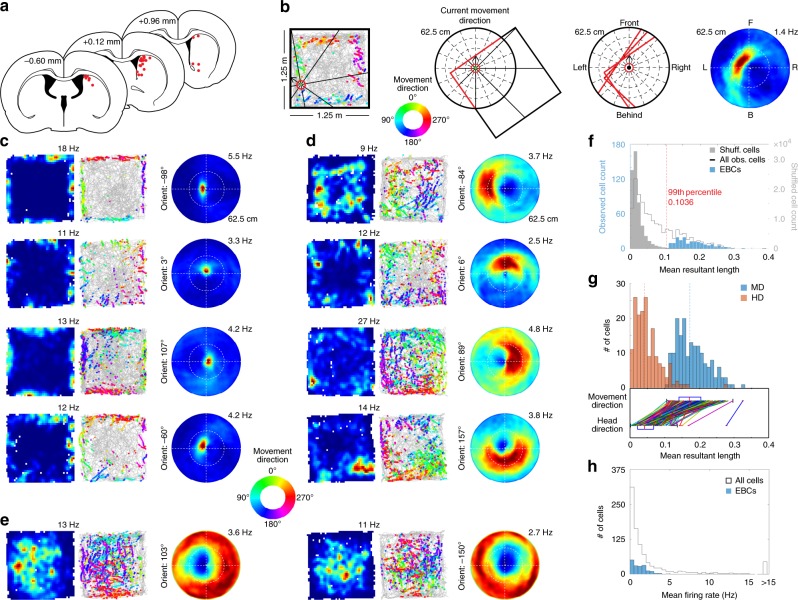
Fig. 1.
Dorsomedial striatal cells respond to environmental boundaries in an egocentric reference frame. a Final tetrode positions. Diagrams were reprinted from The rat brain in stereotaxic coordinates, 7th edition, Paxinos, G. & Watson, C., pages 97, 111 and 123, Copyright 2014, with permission from Elsevier26. b Egocentric boundary ratemap generation (see Methods and Supplementary Fig. 3). c Columns show allocentric spatial ratemaps, trajectory plots with color-coded movement direction spike locations (color wheel legend shown in figure), and egocentric boundary ratemaps for four example egocentric boundary cells (EBCs) with different preferred orientations and a preferred distance close to the animal. The maximum firing rate for each allocentric and egocentric ratemap is displayed above the top right corner of each plot. d Same as in c, but for EBCs with preferred distances distant from the animal. e Same plots as above, but for two inverse EBCs. f Distribution of mean resultant length for observed and shuffled cells. g Distribution of mean resultant lengths for EBCs using movement direction and head direction. h Distribution of mean firing rates

