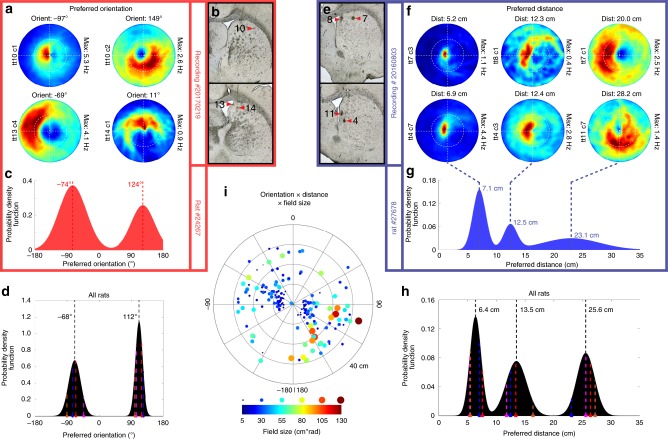
Fig. 2.
Preferred orientation and distance of egocentric boundary cells (EBCs). a Egocentric boundary ratemaps for four simultaneously recorded EBCs with different preferred orientations, specified above each plot, tetrode (tt) number and cell (c) number displayed to the left of each plot and the maximum firing rate displayed to the right of each plot. b Final tetrode locations for cells shown in a. Numbers indicate the tetrode number. c Probability distribution function of preferred orientation for all EBCs from a single rat. d Probability distribution function of EBC preferred orientation peaks from all rats. Colored dashed lines indicate peak locations from each animal. e Final tetrode locations for cells shown in f. f Egocentric boundary ratemaps for six simultaneously recorded EBCs with different preferred distances specified above each plot, tetrode (tt) number and cell (c) number displayed to the left of each plot and the maximum firing rate displayed to the right of each plot. g Probability distribution function of preferred distance for all EBCs from a single rat. h Probability distribution function of EBC preferred distance peaks from all rats. Colored dashed lines indicate peak locations from each animal. i Polar scatter plot of preferred distance vs. preferred orientation for all EBCs with field size represented with both color and dot diameter

