Fig. 3.
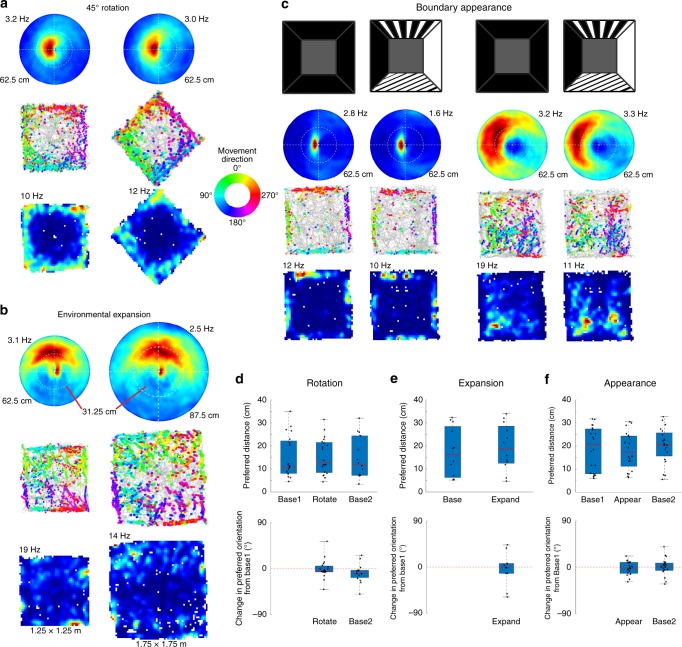
Egocentric boundary cells (EBCs) respond stably to local environmental boundaries. a Egocentric boundary ratemaps with maximum firing rates indicated above each plot, trajectory plots with color-coded movement direction spike locations, and allocentric spatial ratemaps with maximum firing rates indicated above each plot (top to bottom) for an EBC during a baseline and 45° environmental rotation session (left to right). b Same plots as in a, but for the standard 1.25 × 1.25 m2 environment and an expanded 1.75 × 1.75 m2 environment. c Same plots as in a, but for two EBCs (left to right) during recordings with the standard black walls and patterned walls. d–f Box plots of preferred distance (top) and change in preferred orientation from baseline (bottom) where the top and bottom of each box represent the first and third quartile, the red line indicates the median and the whiskers indicate the full range of values for (d) the rotation experiment (preferred distance: Base1: 25th: 8.05, 50th: 11.06, 75th: 22.16 cm, Rotate: 25th: 8.42, 50th: 12.88, 75th: 21.54 cm, Base2: 25th: 7.24, 50th: 12.02, 75th: 24.42 cm; preferred orientation: Rotate: 25th percentile: −6.15, 50th percentile: −3.21, 75th percentile: 5.28° change from Base1, Base2: 25th: −17.34, 50th: −9.30, 75th: −2.80° change from Base1), (e) the expansion experiment (preferred distance: Base: 25th: 6.33, 50th: 16.20, 75th: 28.46 cm; Expand: 25th: 12.51, 50th: 18.68, 75th: 28.58 cm; preferred orientation: Expand: 25th: −12.30, 50th: −1.02, 75th: 7.02° change from Base), (f) the visual appearance experiment (preferred distance: Base1: 25th: 7.96, 50th: 20.74, 75th: 27.44 cm; Pattern1: 25th: 11.21, 50th: 17.42, 75th: 24.37 cm; Base2: 25th: 15.65, 50th: 20.67, 75th: 25.69 cm; preferred orientation: Pattern1: 25th: −12.10, 50th: −2.04, 75th: 9.40° change from Base1; Base2: 25th: −6.30, 50th: 0.40, 75th: 7.80° change from Base1)

