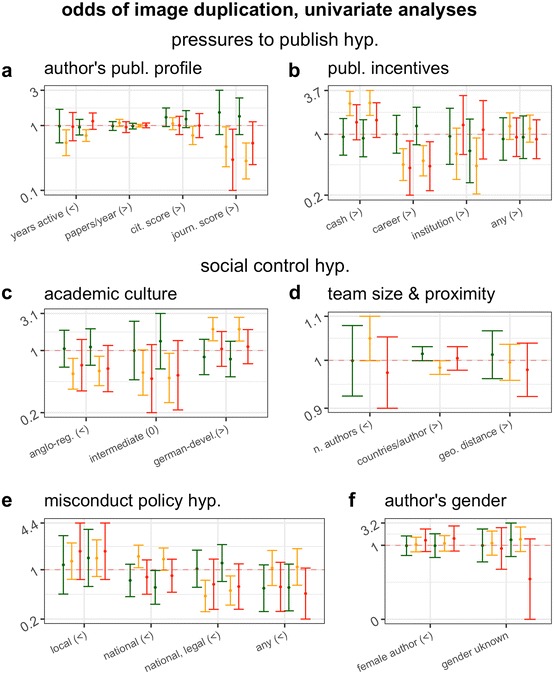
Fig. 1.

Effect (odds ratio and 95% CI) of characteristics of study and of first and last authors on the odds of publishing a paper containing a category 1 (green), category 2 (yellow) or category 3 (red) problematic image duplication. When six error bars are associated with one test, the first three error bars correspond to data from the first author and the last three are for data from the last author. Panels are subdivided according to overall hypothesis tested, and signs in parentheses indicate direction of expected effect (“>”: OR > 1; “<”: OR < 1; “0”: intermediate effect predicted). The more shifted the error bars are from the value of OR = 1 (dotted horizontal line), the larger the magnitude of effect measured. Bars that do not overlap with the OR = 1 line indicate an effect that is statistically significant at the 0.05 level or lower
