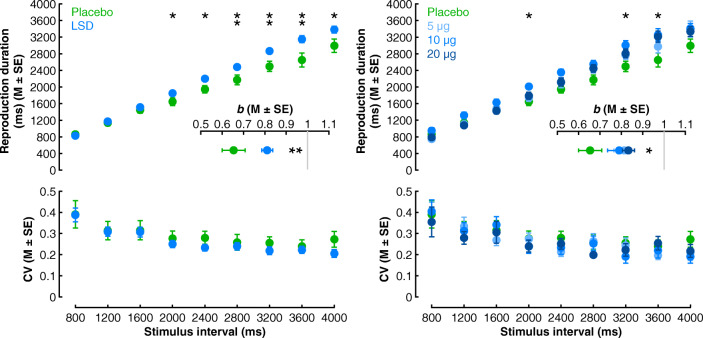
Fig. 2.
Temporal reproduction performance as a function of drug (placebo vs. LSD) (left) and dose (placebo vs. 5 vs. 10 vs. 20 μg) (right). Reproduction durations (top), beta coefficients from within-participant regression analyses of reproduction durations on stimulus intervals (insets), and reproduction variability (coefficient of variation; CV) (bottom). *p < .05, **p < .01

