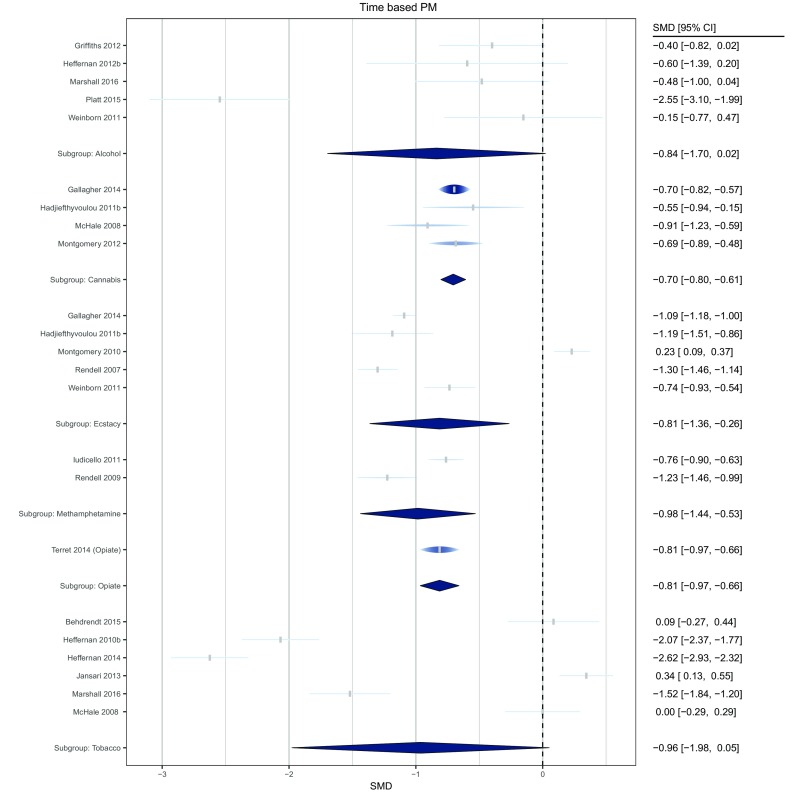
Fig. 4.

Forest plot of comparisons for time-based PM tasks across drug conditions. The width of each node is identical to the width of the confidence interval. The height of each raindrop is scaled with respect to its relative meta-analytic weight considering all studies within the subgroup
