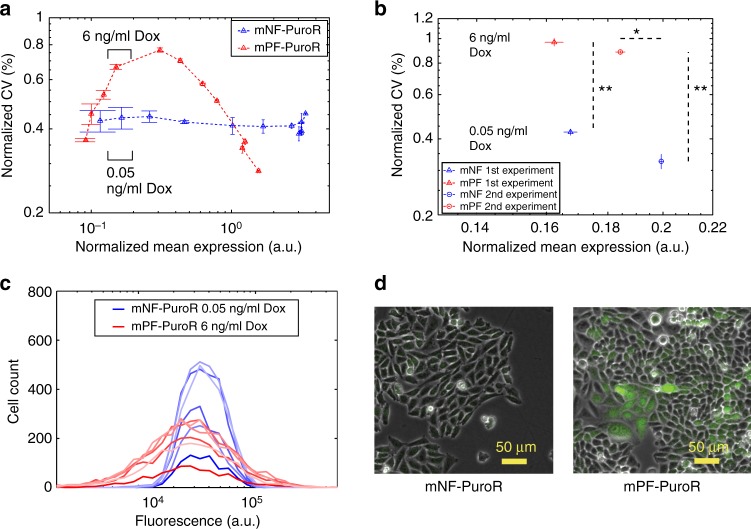
Fig. 4.
Decoupled noise regime and decoupled noise points before treatment. a Plotting the noise (coefficient of variation, CV) as a function of normalized mean gene expression for both gene circuits revealed two decoupled noise regimes. Black brackets indicate the expression range for the Doxycycline (Dox) concentrations used for noise-mean decoupling in (b). Error bars represent the standard error of the mean (n = 3). b Decoupled noise points (DNPs) at the beginning of the two drug treatment experiment sets. The noise was significantly different between gene circuits for both sets (**p value = 0.0022, n = 6, two-tailed Mann–Whitney U test). The mean expression was not significantly different for set 1 (~3%; p value = 0.0931, n = 6, two-tailed Mann–Whitney U test) while it had significance for set 2 (~8%; *p value = 0.0022, n = 6, two-tailed Mann–Whitney U test). The dashed lines display the range of statistically significant differences for gene expression noise and mean expression between the two gene circuits. c Gene expression distributions at the DNP from the first experiment set, filtered as described in the Methods. d Images of cells at the decoupled noise point from the first experiment set. The two-tailed Mann–Whitney U test inferred significance at p values < 0.05. Source data are provided as a Source Data file

