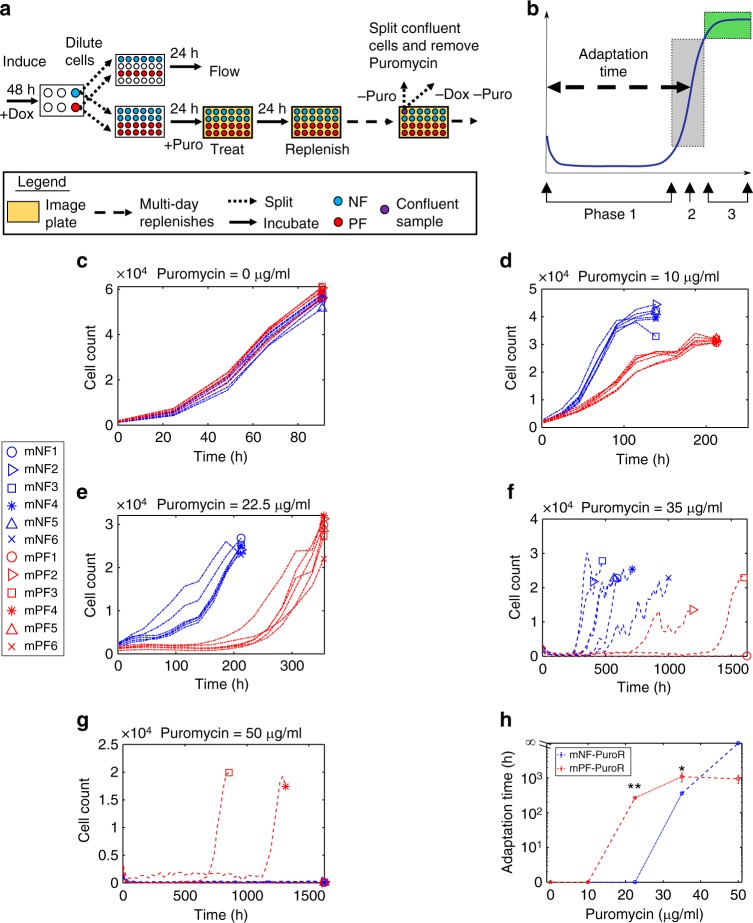
Fig. 5.
Noise hinders resistance under low stress but aids it under high stress. a Experimental workflow of the Puromycin (Puro) treatment assay. Cells induced with Doxycycline (Dox) were treated with Puromycin in a parallel series of plates for imaging or for flow cytometry. Upon confluency, Puromycin was removed temporarily (see Fig. 7). b Illustration of a representative growth curve with three growth phases: (1) growth suppression, (2) regrowth (gray box), and (3) saturation (green box). c–g Growth curves for cells initially tuned to the DNPs under 0 (c), 10 (d), 22.5 (e), 35 (f), and 50 (g) μg/mL Puromycin. Dash-dot growth curves indicate data from the first experimental set while dash-dash growth curves are from the second experiment set. h Mean adaptation times corresponding to (c–g) (**p value = 0.0022, n = 6, two-sided Mann–Whitney U test; *p value = 0.0238, n = 3 for mPF-PuroR and n = 6 for mNF-PuroR, two-sided Mann–Whitney U test). The statistical test on the data from 35 μg/mL Puromycin included the non-growing mPF replicate 1 (infinite replicate adaptation time), which is not included in the mean (nmean = 2 for mPF-PuroR) in (h). The adaptation time error bars represent the standard error of the mean with replicates as described above. The two-tailed Mann–Whitney U test inferred significant differences at p values < 0.05. Source data are provided as a Source Data file

