Fig. 6.
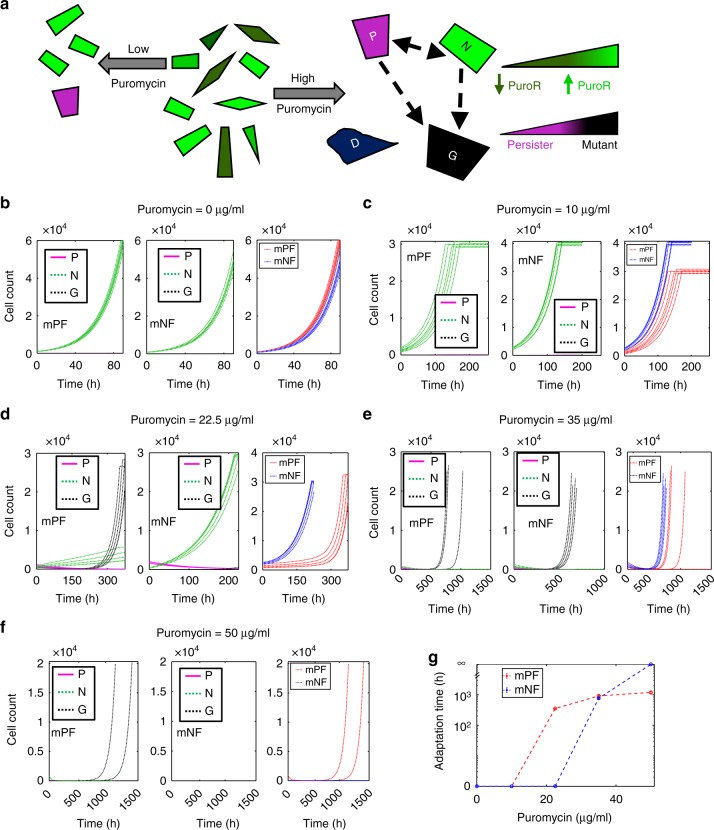
Modeling adaptation of mPF and mNF cells in various Puromycin concentrations. a Schematic depicting the effects of Puromycin concentration on CHO cell population composition and survival. Nongenetically Puromycin-resistant cells (green cells - brighter cells have higher PuroR expression level and are therefore more resistant) and nongrowing persister cells (magenta cells) can switch phenotypes (dashed bidirectional arrow). Persister cells and growing nongenetically resistant cells can also become stably Puromycin-resistant cells (black cells). When no Puromycin is present, a clonal population with heterogeneous gene expression exists (center). Under low Puromycin treatment conditions (left arrow), cells with low PuroR expression perish and a small fraction of the surviving clonal cells become persister cells. For high Puromycin treatment conditions (right arrow), only cells with high PuroR expression levels can survive drug treatment while the rest die (dark blue cells), and a higher fraction of the surviving cells become persisters. As persister and nongenetically resistant cells can become stably drug-resistant, the population on the right panel becomes increasingly heterogeneous over the course of treatment. b–f Representative growth curves for simulated mPF-PuroR and mNF-PuroR CHO cell populations under (b) 0, (c) 10, (d) 22.5, (e) 35, and (f) 50 μg/mL of Puromycin. Growth curves shown in panels in (b–f) correspond to: mPF subpopulations (left), mNF subpopulations (center), and full mPF and mNF populations (right). g Adaptation times corresponding to the mPF-PuroR and mNF-PuroR populations shown in panels (b–f). The model is described in the “Methods” section and parameter values are given in Supplementary Table 2

