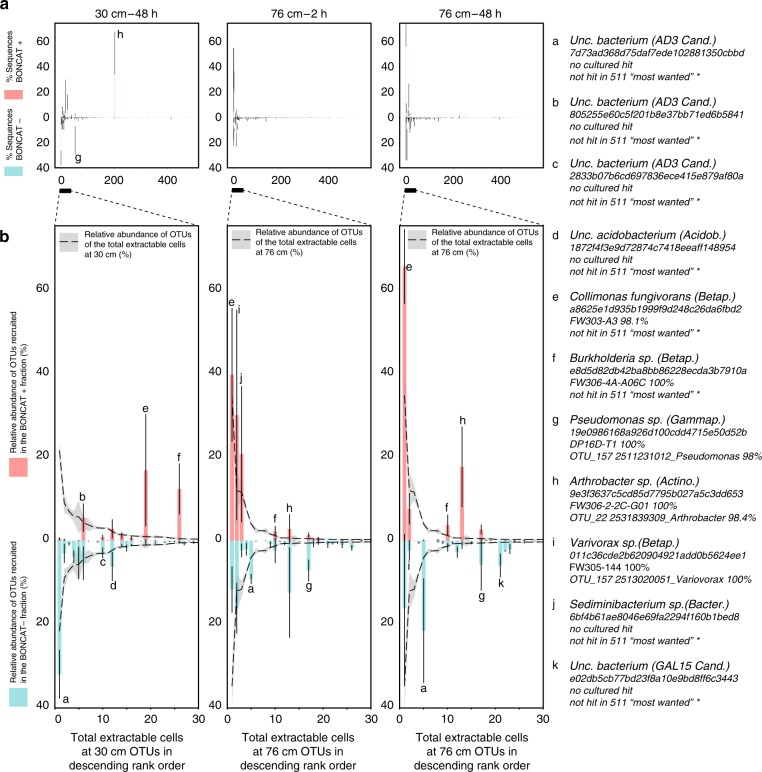
Fig. 3.
Comparing the composition of the BONCAT+ and BONCAT− populations. a Relative abundance (in percent, ±SD, n = 3) of OTUs present in the BONCAT+ (red) and BONCAT− (blue) for the 30 cm–48 h incubation (left panel), 76 cm–2 h incubation (middle panel) and 76 cm–48 h incubation (right panel). The OTUs have been ranked in descending order from left to right according to their relative abundance on the filter samples (all cells detached and captured on a filter). b Close-up on the 30 most abundant OTUs overlaid with their abundance on the filter samples (dashed line, ±SD shows as gray shading n = 3). The most abundant OTUs are indexed from a to k. Their taxonomy, ID, hit in the ENIGMA culture collection and matches to the 511 most abundant soil microbiome29 is provided on the right legend panel. Error bars represent standard deviation (n = 3)

