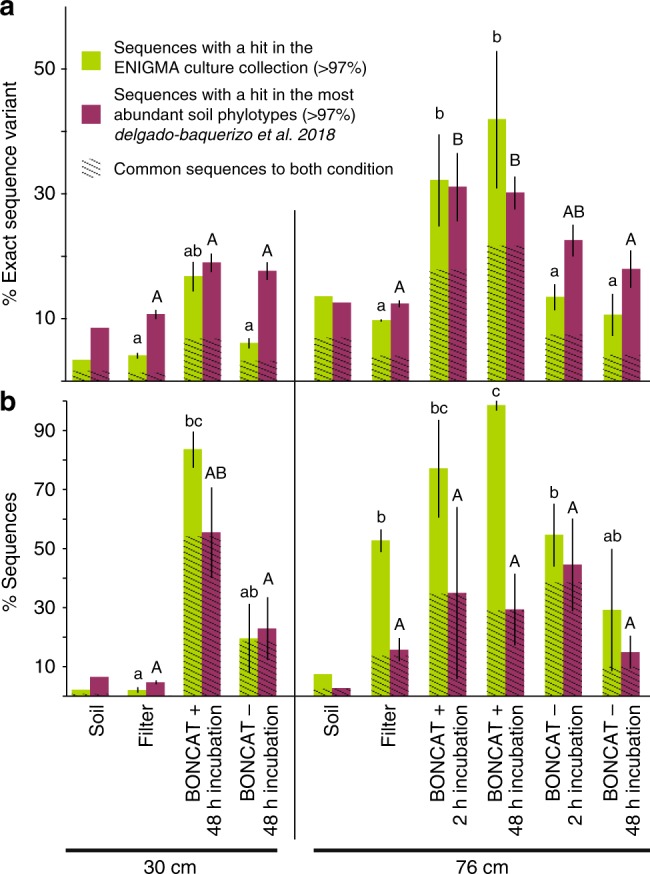
Fig. 4.

Prevalence of soil isolates and ubiquitous soil OTUs among BONCAT+ cells. a Percent features (non-clustered DADA2 results) and b percent sequences from the current libraries with a hit (>97% sequence similarity) in the ENIGMA culture collection (this collection contains 697 full-length 16S rRNA gene from strains that were isolated from the same field site as the samples considered in this study) (green), in the set of 511 phylotypes identified as the most abundant by29 (yellow) or both (dashed area). Data are average (n = 3) ± SD, letters indicate ANOVA post hoc significant differences. “soil” samples are libraries constructed from total DNA extracted from soil, “filter” samples are DNA extracted from all cells detached from soil and captured on a 0.2 µm filter, BONCAT+ and BONCAT- libraries were constructed from corresponding cell sorted samples
