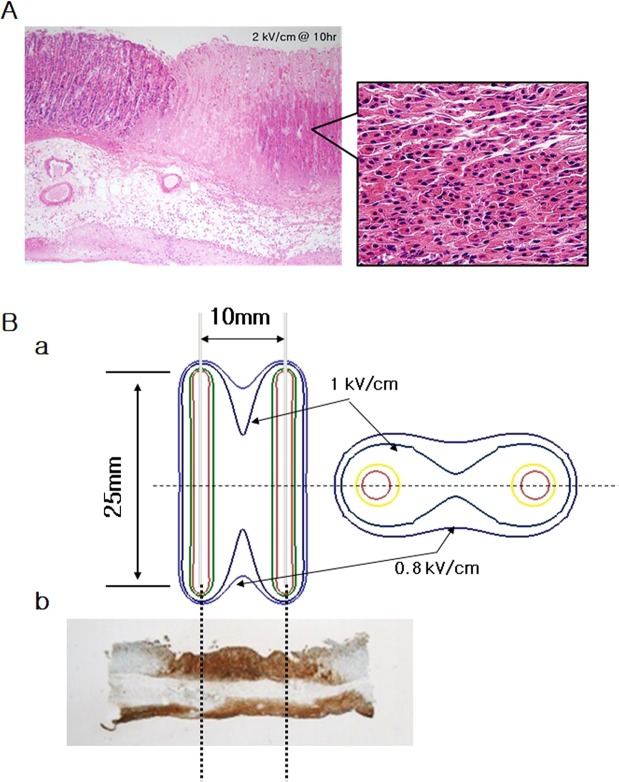
Figure 6.
The stomach mucosa (H&E) and the contours of the electric energy density and the shape of ablated tissue according to the theoretical model. (A) At 10 h after the application of irreversible electroporation, mucosal tissue was seen to be conserved in the nonelectroporated area. (B) The contours predict the ablation area made by the applied electrical energy. The arrow indicates the boundary of the ablated tissue and value of electric field strength is normalized to the critical electric energy density for an ablation of 50 pulses (a). During TUNEL assay, IRE of 2 kV/cm with 50 pulses was applied to the tissue (b).

