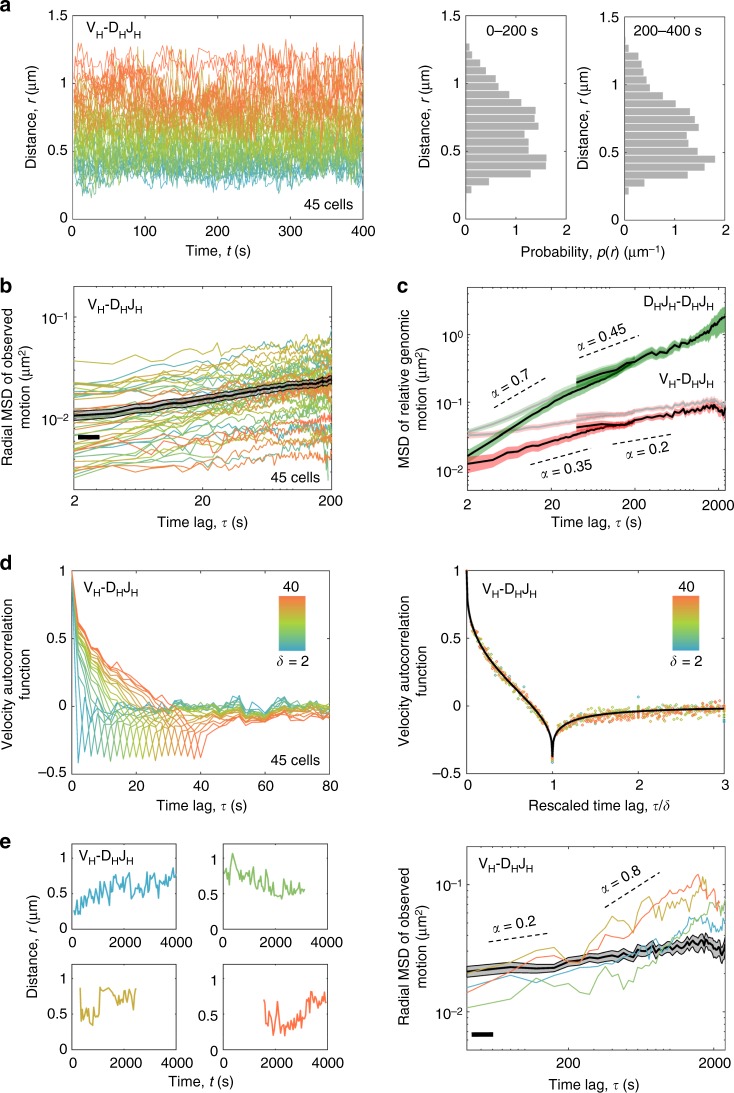
Fig. 3.
VH-DHJH motion in B-cell progenitors is extremely confined. a The spatial distances separating VH and DHJH elements for the majority of cells fluctuated around their respective average values that remained nearly constant over time. Color-coding the distance trajectories according to their mean values reveals a “demixing” effect. Right panel shows the corresponding probability distribution of VH-DHJH distances. b The time-averaged radial MSD (colored lines) and the time-and-ensemble-averaged radial MSD (black line) for VH-DHJH motion. c Time-and-ensemble-averaged MSD of relative genomic motion for inter-chromosomal DHJH-DHJH pair (green) and intra-chromosomal VH-DHJH pair (red) before (pale lines) and after (bright lines) measurement-error correction. d Velocity autocorrelation functions for the VH-DHJH motion exhibit anti-correlations indicative of a push-back from the environment; the value at the dip approaches the theoretical limit (−0.5) of an extreme confinement. The collapse of the velocity autocorrelation function curves upon rescaling of the time axis (right panel) indicates self-similarity of motion. Source data are provided as a Source Data file. e Left panel shows the VH-DHJH trajectories that, unlike those in a, exhibited substantial changes in their mean values over time. Right panel shows the radial MSD curves (colored lines) for the individual cells that displayed abrupt changes in VH-DHJH motion and, for comparison, the time-and-ensemble-averaged radial MSD (black line) for VH-DHJH motion in the majority of cells. Scaling exponents (α) are indicated. Source data are provided as a Source Data File

