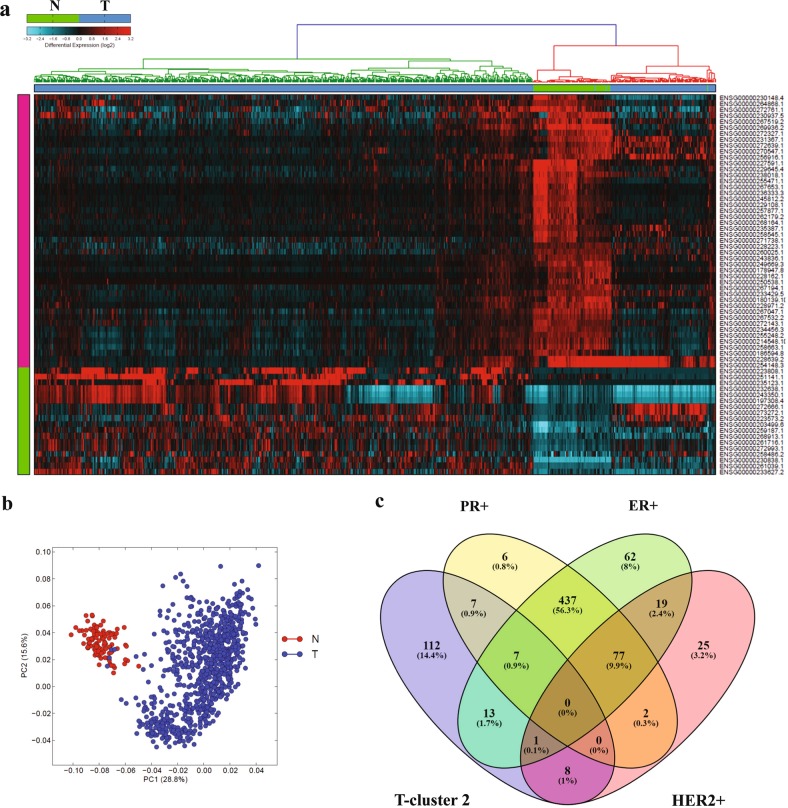
Fig. 1. lncRNA transcriptional portrait in breast cancer compared to normal tissue.
a Hierarchical clustering of breast cancer (n = 837) and normal (n = 105) breast tissue based on differentially expressed lncRNA transcripts. Each column represents one sample and each row represents a transcript. Expression level of each transcript (log2) in a single sample is depicted according to the color scale. b Principal component analysis (PCA) for the lncRNA transcriptome of breast cancer and normal breast tissue. c Venn diagram depicting the overlap between tumors samples from tumor cluster 2 (T-cluster 2) on the further right of the heatmap in panel (a) and the indicated breast cancer molecular subtype

