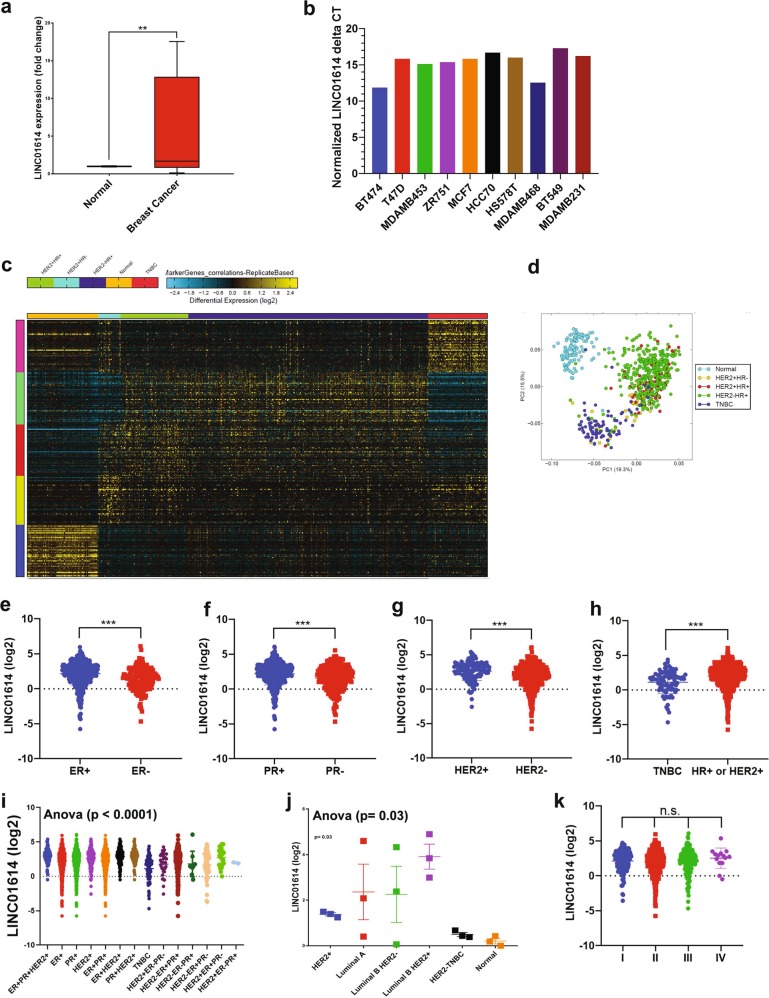
Fig. 4. Correlation between the expression of LINC01614 and BC molecule subtype.
a Expression of LINC01614 in eight BC patients (red box) and adjacent normal tissue (blue box) using qRT-PCR. Data are presented as mean ± S.E., n = 8 for each group. b Expression of LINC01614 in a panel of BC cell lines. Data are presented as normalized delta CT expression value. (c) Heat map clustering of BC (n = 837) and normal (n = 105) breast tissue based on molecular subtypes of BC (HER2 + HR+, HER2+HR−, HER2-HR+, TNBC, and normal). Each row represents expression level of the indicated lncRNA (log2). Expression level of transcriptomes in a single sample is depicted according to the color scale (blue to yellow). (d) Principal component analysis (PCA) for the indicated BC molecular subtypes and normal breast tissue. Expression of LINC01614 in relation to estrogen receptor (ER, e), progesterone receptor (PR, f), and HER2 (g) status. h Expression of LINC01614 in TNBC vs non-TNBC BC patients. i Expression of LINC01614 in the indicated molecular subtype subgroups. j Expression of LINC01614 in the SRP062132 dataset in relation to the indicated molecular subtype. k Expression of LINC01614 in relation to the tumor stages

