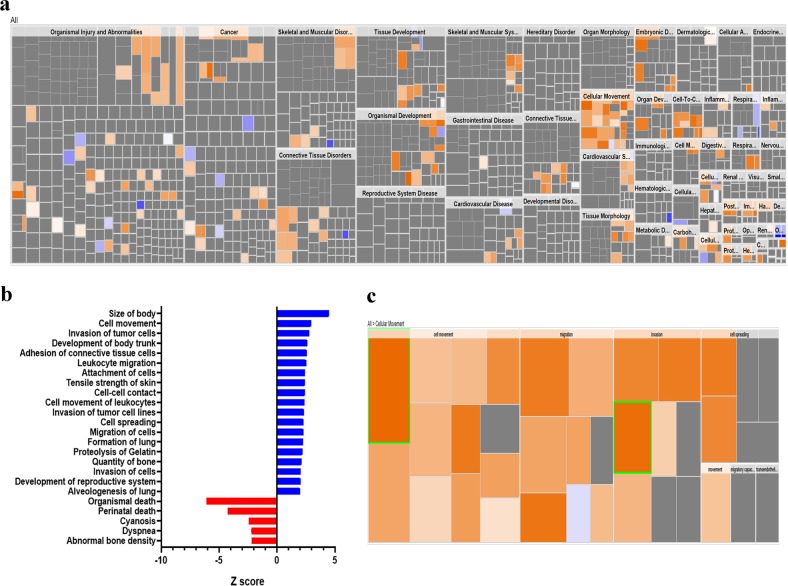
Fig. 5. Enrichment in tumor cell migration and invasion functional categories in LINC01614high BC patients.
a Disease and function heat map depicting enrichment in the indicated functional and disease categories in the upregulated transcripts in LINC01614high vs LINC01614low BC patients based on IPA analysis. b Bar-graph depicting the most significantly affected factional categories in LINC01614high vs LINC01614low BC patients. c Heat map-illustrating enrichment in cellular movement functional category

