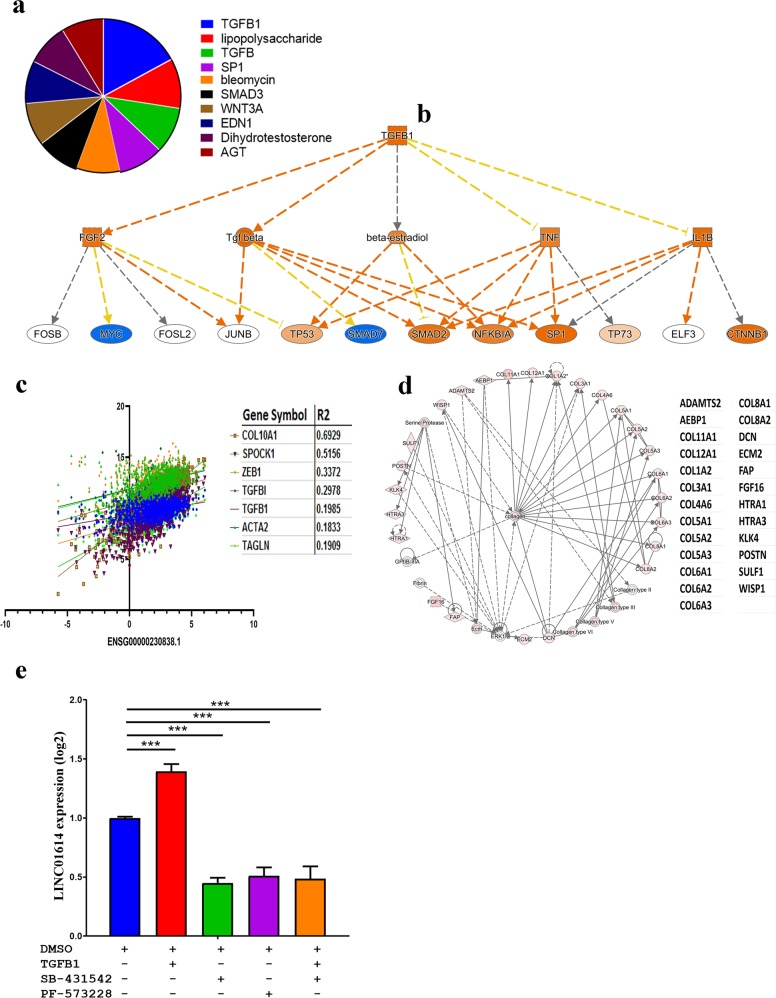
Fig. 6. Mechanistic network analysis predicts predominant activation of the TGFB pathway in LINC01614high BC tumors.
a Pie chart illustrating the top activated mechanistic networks in LINC01614high BC tumors based on IPA analyses. Segment size corresponds to the activation Z score. b Illustration of the TGFβ1 signaling network. c Correlation between the expression of LINC01614 and the expression several members of the TGFβ family in BC tumors. d Extra cellular matrix functional enrichment in LINC01614high BC tumors. Color intensity indicates their activation state. Effect of recombinant TGFβ (10 ng/ml), SB-431542 (ββ inhibitor, 10 µM), and PF-573228 (FAK inhibitor, 5 µM) on LINC01614 expression measured by qRT-PCR. Data are presented as mean ± S.E. from two independent experiments, n = 6

