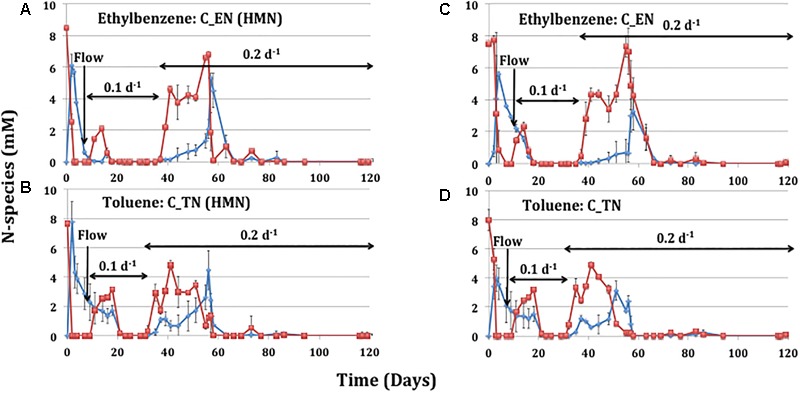
FIGURE 1.

Concentrations of nitrate ( ) and nitrite (
 ) in effluents of ABO-NRB continuous cultures as a function of time. The continuous cultures were maintained at dilution rates of 0.1 or 0.2 d-1. Prior to starting flow the cultures were grown in 98 mL of aqueous medium with 10 mM nitrate and (A) 60.6 mM ethylbenzene in 2 mL of HMN, (B) 71.2 mM toluene in 2 mL of HMN or in 100 mL of aqueous medium with 10 mM nitrate and (C) 1.2 mM of aqueous ethylbenzene or (D) 1.4 mM of aqueous toluene. During flow the continuous cultures received medium with 10 mM nitrate and 1.2 mM of aqueous ethylbenzene (A,C) or 1.4 mM of aqueous toluene (B,D).
