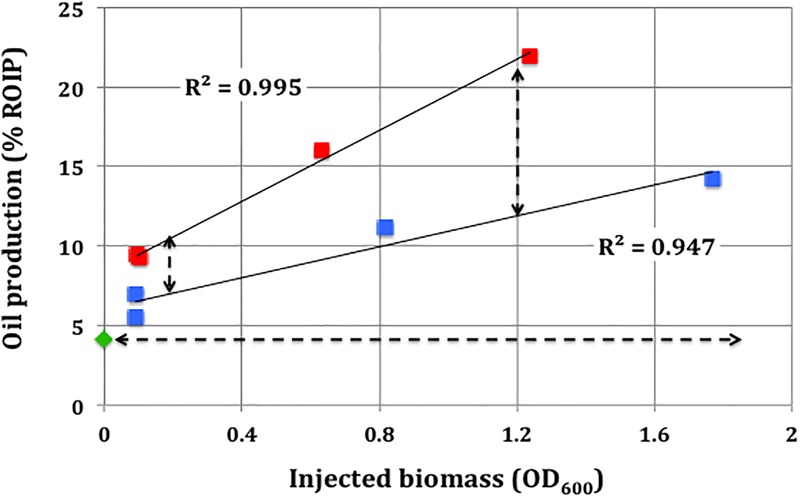
FIGURE 5.

Oil production from high pressure columns as a function of injected biomass concentration (OD600). Oil production (% ROIP) from columns incubated with injected biomass without nitrate ( ) and with 80 mM nitrate (
 ) is shown. The diamond (
 ) represents a negative control without added inoculum. The horizontal dotted line indicates oil production in the negative control. The vertical dotted lines indicate the increase in oil production due to the presence of nitrate.
